Consider it your morning meditation. Or an opportunity to learn something about cell motility.
Consider it your morning meditation. Or an opportunity to learn something about cell motility.

I don’t understand how this happens. You’ve got a good academic position. You’re bringing in reasonable amounts of grant money. You’re publishing in Nature Genetics and Nature Structural and Molecular Biology. And you don’t even understand the basic concepts in your field of study.
For instance, here’s a press release titled “Cause of genetic disorder found in 'dark matter' of DNA”.
For the first time, scientists have used new technology which analyses the whole genome to find the cause of a genetic disease in what was previously referred to as "junk DNA". Pancreatic agenesis results in babies being born without a pancreas, leaving them with a lifetime of diabetes and problems digesting food. In a breakthrough for genetic research, teams led by the University of Exeter Medical School and Imperial College London found that the condition is most commonly caused by mutations in a newly identified gene regulatory element in a remote part of the genome, which can now be explored thanks to advances in genetic sequencing.
Regulatory elements are not and have never been considered junk DNA. The researchers have identified a regulatory region called PTF1A that has allelic variations that cause a failure of the pancreas to form. That’s really interesting! But then you read what they have to say about it, and they are completely oblivious to the literature on genetic structure and gene regulation. Isn’t that something you’d expect them to have studied thoroughly before even proposing this project?
Or how about this press release, “Un-junking junk DNA”. It’s gotten to the point where I just cringe when I see the phrase “junk DNA” in a press release, because it is a sure sign of flamboyant ignorance to come.
"This study provides answers for a decade-old question in biology," explained principal investigator Gene Yeo, PhD, assistant professor of Cellular and Molecular Medicine, member of the Stem Cell Research Program and Institute for Genomic Medicine at UC San Diego, as well as with National University of Singapore. "When the sequence of the human genome was fully assembled, under a decade ago, we learned that less than 3 percent of the entire genome contains information that encodes for proteins. This posed a difficult problem for genome scientists – what is the other 97 percent doing?"
The role of the rest of the genome was largely a mystery and was thus referred to as "junk DNA." Since then sequencing of other, non-human, genomes has allowed scientists to delineate the sequences in the genome that are remarkably preserved across hundreds of millions of years of evolution. It is widely accepted that this evidence of evolutionary constraint implies that, even without coding for protein, certain segments of the genome are vital for life and development.
So many misconceptions. No, noncoding DNA is not synonymous with junk DNA; junk DNA was not so called because its function was mysterious; it is absolutely no surprise that some regions of the genome are vital, even without coding for proteins — haven’t they heard of tRNA or miRNA? Developmental biologists have been yapping for decades about the importance of the switches that control gene regulation…are we just ignored?
I worry that this is a symptom of a serious rot in science education — that we’re turning out great technicians and masters of the arcane art of grant writing who don’t actually understand biology, and in particular have no perspective on what the questions actually are. They may be excellent middle managers, but the comprehension and vision are lacking.
I have a suggestion. If you’re going to do research that leads you to say anything about junk DNA, I urge you to read carefully one or all of the following books: The Origins of Genome Architecture by Michael Lynch; Fundamentals of Molecular Evolution
by Dan Graur and Wen-Hsiung Li; or The Logic of Chance: The Nature and Origin of Biological Evolution
by Eugene Koonin. Those aren’t lightweight texts — I wouldn’t assign them to your average undergraduate — but hey, you’re a big-time professional scientist. There’s no excuse for not knowing this stuff.


What if the National Association of Science Writers convened a panel on sexual harassment and discrimination, and no one cared? This report on sexual harassment and science writing at NASW is strangely, delicately neglectful, from the beginning where it irrelevantly claims that the Bora Zivkovic story no longer dominates science blogs (So has sexual harassment vanished? Or should we be asking where it will rise up again?), to the bizarrely abrupt segue in which they “Return You to Our Regularly Scheduled Program”, which is all about calculating the number of habitable worlds in the galaxy and more self-promoting fluff from SETI. Apparently, the concerns of women in science is of dwindling concern and a distraction from the Important Subjects of Speculative Astronomy.
The middle is equally weird. It has two sections: Hearing from Women, a two paragraph summary of what the women on the panel said, followed by Hearing from Men, with four paragraphs dedicated to the reactions (admittedly sympathetic) of the men in the audience, which are described as “some of the most powerful and significant statements”. At least the women’s section closed with an ironic comment: “The medical profession is now also heavily female, she [Ginger Campbell] said, but there, too, invisibility is everywhere.” How true that is.
I would like to have read more about “Hearing from Women”, but not only could the writer not be troubled to include more of the women’s statements, but she didn’t even bother to link to any of the panelists. I can correct that, at least: Christie Aschwanden, Deborah Blum, Florence Williams, Kate Prengaman, Kathleen Raven, Maryn McKenna, and Emily Willingham. Isn’t that odd that an article purportedly about this panel didn’t even link to the panelists’ professional pages, neglected to even name one of them, yet still made that special effort to capture men’s opinions on it?
You should read Emily Willingham’s assessment of the article. It’s not at all flattering.
Start looking for the invisible women, and it’s amazing how often you can find these curious omissions. Here, for instance, is a student at Michigan State plugging the virtues of social media for advancing your career in science (and I agree with him!), but he’s especially promoting reddit as a tool…which is problematic if you’re a woman, or have a reputation as a feminist. He touts reddit as the “best bang for the buck” for “thousands of young men and women” and obliviously shows this graph of internet readers who use reddit, titled “Young males are especially likely to use reddit.”
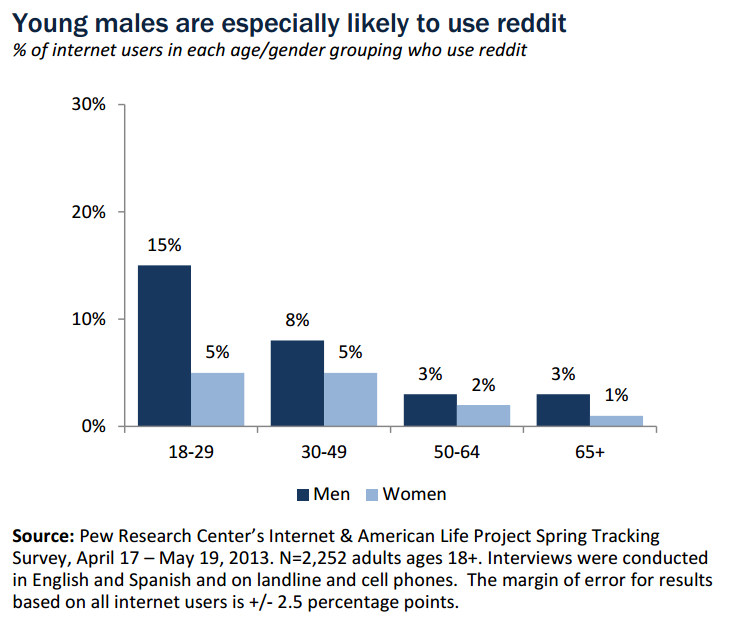
Apparently we can just ignore the pale blue bars that show that women represent somewhere less than a third of the audience you’ll reach on reddit. We’re not even going to notice the discrepancy, even if it leaps out at you as the most significant factor illustrated by the chart, and even if the title itself calls attention to it. The sexism problem on reddit isn’t even worth mentioning in an article about promoting science.
But that’s the big question that ought to be asked. Why isn’t it? Because invisible people aren’t as important.
Finally, here’s something that’s at least stirring and loud. It’s from a television show (as we all know, fictitious politicians are far more honest and bold than the real ones) in which a woman points out all the subtle signifiers the media and other politicians use to put her in her place.
Are you saying that Governor Reston is sexist?
Yes. I am. And it’s not just Governor Reston speaking in code about gender. It’s everyone, yourself included. The only reason we’re doing this interview in my house is because you requested it. This was your idea. And yet here you are, thanking me for inviting me into my “lovely home.” That’s what you say to the neighbor lady who baked you chocolate chip cookies. This pitcher of iced tea isn’t even mine. It’s what your producers set here. Why? Same reason you called me a “real live Cinderella story.” It reminds people that I’m a woman without using the word.
For you it’s an angle, and I get that, and I’m sure you think it’s innocuous, but guess what? It’s not. Don’t interrupt me when I’m speaking. You’re promoting stereotypes, James. You’re advancing this idea that women are weaker than men. You’re playing right into the hands of Reston and into the hands of every other imbecile who thinks a woman isn’t fit to be commander-in-chief.
Don’t you ever forget, ladies, that the most important parameter of your existence is how well you fit your stereotyped role. But don’t worry, no one will ever let you forget it.

I am not a fan of the convergent evolution argument for humanoid aliens. I can well believe that it’s likely that intelligent aliens exist out there in the universe, but I’m not even going to try to predict what they look like: there are too many alternative paths that are possible. But for some reason, many people like to insist that it’s reasonably likely that they’d resemble us in general, if not in detail, and they’ll then go on to extrapolate that behaviorally and culturally they’ll share many properties with us. Usually, as with Simon Conway Morris and now George Dvorsky, this argument relies entirely on the premise of convergent evolution.
It annoys the hell out of me, because it requires waving away or consciously ignoring basic principles of evolution. Here’s how Dvorsky illustrates the concept:
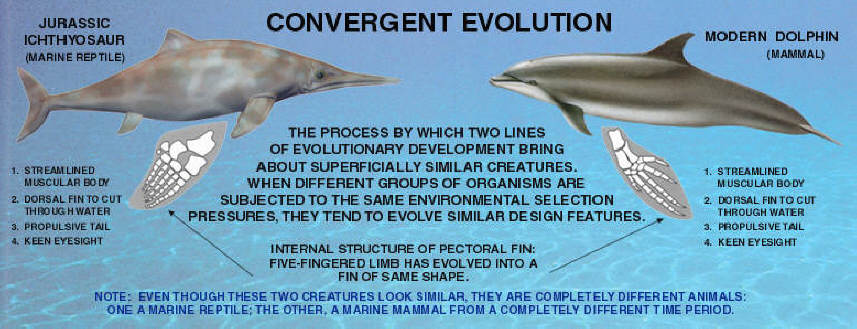
I’ve seen versions of this illustration a thousand times. Gosh, look, dolphins and ichthyosaurs all have paddle-shaped fins and streamlined bodies! Therefore, this is evidence that aquatic forms all converge on similar morphologies. And therefore, intelligent, terrestrial organisms will also converge on an ideal form for their niche, which is ours also, therefore we represent a morphological ideal.
I hate the argument because it isn’t applicable to alien species. In both cases shown above, the organisms involved belong to the same subphylum, the Vertebrata, and the same superclass, the Tetrapoda. They share a common ancestor, and the same starting point. When you start with a terrestrial creature that looks like this, with four limbs and a suite of similar traits…

…and then let it re-adapt to a marine life as a free-swimming, active predator after long detours into mammalian and reptilian forms, is it any surprise that they converge on similar structures? They are both constrained by their ancestry! The four-finned torpedo does not necessarily represent an ideal form that will be recreated on every planet we ever someday visit, but is instead a compromise, a form that can be generated from a four-limbed vertebrate with a minimum of fuss.
But what if we look at organisms with more remote ancestry? A whole different phylum, perhaps? If we start down the evolutionary road with a conchiferan sort of creature, a mollusc…

…which later evolves into a free-swimming, active predator, you get this:

That’s something that looks completely different from a fish-like ichthysaur or dolphin; it’s got a completely different shape, a completely different set of feeding behaviors, a completely different internal organization.
We could ask the same question of other phyla. Where are the sleek torpedo shaped crustaceans sporting a nice dorsal fin and quartet of paddles? Show me a marine annelid that has followed this same path.
Now keep in mind that life on another planet will share no ancestry with anything on Earth. If our history is any example, they will be the product of a few billion years of single-celled tinkering, with a riotous adaptive radiation of multicellular forms that will explore a small fraction of morphospace…and every step will be contingent on prior states.
You can only make this ludicrous convergence argument if you think 1) contingency is relatively unimportant, that 2) adaptation is extremely powerful and will always drive a species towards an optimum, and that 3) the shape of a relatively tiny subset of species on this planet represent that optimum. There is a fourth requirement as well: you must be oblivious to the fact that (2) and (3) contradict each other.

Science is always working a tough room. It’s inherently progressive — we’re constantly achieving incremental improvements in our understanding, with occasional lurches forward…and sometimes sudden lurches backward, when we realize that we got something wrong. We’re performing for a crowd, the general citizenry and most importantly, the funding agencies, that expect us to fix problems and make the world better, and they’re a fickle bunch who will turn on us with disdain if we don’t keep delivering new medical therapies and tinier electronics and more spectacular robots landing on alien worlds.
Unfortunately, there are a couple of sources of tension in our act.
One problem is that we aren’t doing what everyone thinks we’re doing. The world outside the sciences thinks we’re all about making material improvements in your standard of living, or increasing our competitiveness with other countries. Wrong. We do what we do to increase our understanding. There is an applied side to science that is asking about, for instance, better treatments for cancer, but it’s built on a foundation of scientists just asking, “how do cells work?”
An analogy: imagine building race cars. Everyone watching is thinking that it’s all about winning races (that’s also the case for the backers who are paying for all the machines). But the scientists are the ones who are just thinking about what’s going on inside the engine, tracing the flow of fuel and energy, optimizing and adjusting to make it work. Put a scientist in the driver’s seat, and she wouldn’t be thinking about winning the race; if she heard a mysterious “ping!” at some point, her instinct would be to just pull over then and there and take things apart until she’d figured out what caused it. And figuring out the ping would be more satisfying than finishing the race.
So everyone criticizes the scientist for not winning any races, but the scientist is feeling triumphant because her performance wasn’t what you thought it was — she learned a little bit more about what makes the engine tick, and you should be happy about that!
So that’s one source of tension. Here’s another: funding and public support thrives on positive results, that constant reassurance that yes, we’re proceeding apace towards the finish line, but science itself thrives on criticism. Probing and patching and making fruitful errors and getting criticism that forces us to reconsider our premises and rebuild our hypotheses…that’s the progressive force behind science. And we should be appreciative when someone tells us that a major chunk of research is invalid (and as scientists, we are), but at the same time, we’re thinking that if we have to retool our labs, retrain our students, rethink everything from the ground up, as exciting as it is in a scientific sense, it’s going to be a really hard sell to NSF or NIH. The granting agencies, and the media, love the safe, reliable churn of data that looks like progress from the outside.
Which brings me to an interesting argument. On one side, John Horgan gets all cynical and critical of science, pointing out deep and fundamental flaws in peer review, the overloading of science journals with poor quality work, the lack of progress in many of our goals for science, and bemoaning the reassuring positivity of the media towards science.
…I’m struck once again by all the “breakthroughs” and “revolutions” that have failed to live up to their hype: string theory and other supposed “theories of everything,” self-organized criticality and other theories of complexity, anti-angiogenesis drugs and other potential “cures” for cancer, drugs that can make depressed patients “better than well,” “genes for” alcoholism, homosexuality, high IQ and schizophrenia.
And he’s right! We don’t have any cures for cancer or schizophrenia, and as he also points out, the scientific literature is littered with trash papers that can’t be replicated.
But on the other side, Gary Marcus says wait a minute, we really have learned a lot.
Yet some depressed patients really do respond to S.S.R.I.s. And some forms of cancer, especially when discovered early, can be cured, or even prevented altogether with vaccination. Over the course of Horgan’s career, H.I.V. has gone from being universally fatal to routinely treatable (in nations that can afford adequate drugs), while molecular biologists working in the nineteen eighties, when Horgan began writing, would be astounded both by the tools that have recently been developed, like whole-genome-sequencing, and the detail with which many molecular mechanisms are now understood: reading a biology textbook from 1983 is like reading a modern history text written before the Second World War. Then there is the tentative confirmation of the Higgs boson; the sequencing of Neanderthal DNA; the discovery of FOXP2, which is the first gene decisively tied to human language; the invention of optogenetics; and definitive proof that exoplanets exist. All of these are certifiable breakthroughs.
And he’s right!
See what I mean? It’s conflict and tension all the way through. The thing is that the two are looking at it from different perspectives. Horgan is asking, “how many races have we won?” and finds the results dispiriting. Marcus is asking “have we figured out how the engine works?” and is pleased to see that there is an amazing amount of solid information available.
Here, for example, are some data on cancer mortality over time. In this instance, we are actually looking at the science as a race: the faster that we can get all those lines down to zero, the happier we’ll all be.
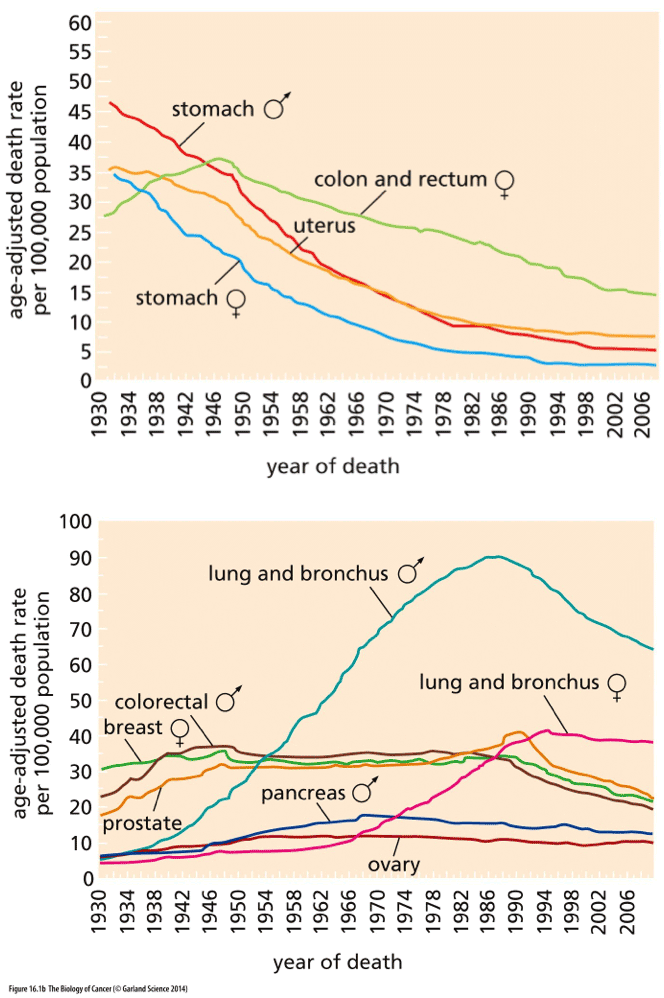
Weinberg, The Biology of Cancer
Look at the top graph first. That’s where we’re doing well: the data from stomach and colon and uterine cancer show that those diseases are killing a smaller percentage of people every year (although you can probably see that the curves are beginning to flatten out now). Science did that! Of course, it’s not just the kind of science that finds a drug that kills cancer; much of the decline in mortality precedes the era of chemotherapy and molecular biology, and can be credited to better sanitation and food handling (hooray for the FDA!), better diagnostic tools, and changes in diet and behavior. We’re winning the war on cancer!
Wait, hold on a sec, look at the bottom graph. It’s more complicated than that. Look at lung cancer; science was helpless against the malignant PR campaigns of the tobacco companies. Some cancers seem relentless and unchangeable, like pancreatic and ovarian cancer, and show only the faintest hint of improvement. Others, like breast cancer, held steady in their rate for a long time and are just now, in the last few decades, showing signs of improvement. It’s complicated, isn’t it? Horgan is right to point to the War on Cancer and say that the complex reality is masked by a lot of rah-rah hype.
But at the same time…Horgan got his journalism degree in 1983, and I got my Ph.D. in 1985. He’s on the outside looking in and seeing one thing; over that same time period, I’ve been on the inside (still mostly looking in), and I’ve seen something completely different.
If I could show my 1985 self what 2013 science publishes as routine, 1985 self would be gibbering in disbelief. Transgenic mice? Shuffling genes from one species to another? Whole genome sequencing? Online databases where, with a few strokes of the keyboard, I can do comparisons of genes in a hundred species? QTLs that allow us to map the distribution of specific alleles in whole populations? My career spans an era when it took a major effort by a whole lab group to sequence a single gene, to a period when a grad student could get a Ph.D. for completing the sequencing of a single gene, to now, when we put the DNA in a machine and push a button.
You can look at those charts above and wonder where the cure for cancer is, or you can look at all the detailed maps of signaling pathways that allows scientists to say we understand pretty well how cancer works. Do you realize that hedgehog was only discovered in 1980, and the activated human ras oncogene was only identified in 1982? It’s rather mindblowing to recognize that genes that we now know are central to the mechanisms of cancer have only emerged in the same short period that Horgan finds disappointing in the progression of science.
Everyone on the outside is missing the real performance!
Unfortunately, a growing problem is that some of the people on the inside are also increasingly focused on the end result, rather than the process, and are skewing science in unfortunate directions. There’s grant money and tenured positions on the line for getting that clear positive result published in Cell! As Horgan points out, “media hype can usually be traced back to the researchers themselves”. We’ve seen that with dismaying frequency; recently I wrote about how the ENCODE project seems to have fostered a generation of technicians posing as scientists who don’t understand the background of biology (and Larry Moran finds another case published in Science this week!). We’re at a period in the culture of science when we desperately need more criticism and less optimism, because that’s how good science thrives.
That’s going to be tricky to deliver, though, because the kind of criticism we need isn’t about whether we’re winning the race or not, or translating knowledge into material benefits or not, but whether the process of science is being led astray, and how that’s happening: by the distorting influence of big biomedical money, by deficiencies in training scientists in big picture science, or by burdensome biases of science publication, or by all of the above and many more.
But ultimately we need the right metrics and to have well-defined outcomes that we’re measuring. It doesn’t help if the NIH measure success by whether we’ve cured cancer or not, while scientists are happily laboring to understand how cell states are maintained and regulated in multicellular eukaryotic organisms. Those are different questions.

Now, in addition to controlling who you are allowed to have sex with and how long you are supposed to be pregnant, the Republicans want to make sure science goals are short term and in the “national interest”.
Key members of the US House of Representatives are calling for the National Science Foundation (NSF) to justify every grant it awards as being in the “national interest”. The proposal, which is included in a draft bill from the Republican-led House Committee on Science, Space, and Technology that was obtained by Nature, would force the NSF to document how its basic-science grants benefit the country.
Yeah, OK, so how does working out the interactions in the hedgehog signaling pathway “benefit the country”? How does measuring the lipid composition of neurons in the substantia nigra “benefit the country”? How does documenting the identity of waxes on the abdomens of fruit flies “benefit the country”? Shall we just stop all research that doesn’t make a profit, doesn’t improve the range of cruise missiles, and doesn’t directly improve heart disease treatments for sclerotic old conservatives?
This is a first step in imposing a patriotism requirement on science…and a first step in killing the enterprise altogether.
It’s also terrifying that judging the worth of science is being put in the hands of Republicans — the know-nothing party of ignorant Jebus-lovin’ buffoons. (It would also be terrifying to see it under the thumbs of the credulous new-agey clowns in the other party — how about keeping science apolitical?)

Last month, I wrote about the terrible botch journalists had made of an interesting paper in which tweaking regulatory sequences called enhancers transgenically caused subtle shifts in the facial morphology of mice. The problem in the reporting was that the journalists insisted on calling this a discovery of a function for junk DNA — the paper itself said no such thing, but somehow that became the dominant message of the popular press coverage. Strange. How did that happen?
So Dan Graur wrote to the corresponding author to find out how the junk crept in. He found out. It’s because the author doesn’t understand the science. Axel Visel wrote back:
When I talk to general audiences (or journalists) about my research, I generally explain that the function of most of the non-coding portion of the genome was initially unclear and many people thought of it as “junk DNA”, but that it has become clear by now that many parts of the non-coding genome are functional – as we know from the combined findings of comparative genomics, epigenomic studies, and functional studies (such as the mouse knockouts in our paper).
Aargh. Non-coding is not and never has been a synonym for junk. We’ve known that significant bits of non-coding DNA are functional for a period longer than I’ve been alive…and I’m not a young guy anymore. The mouse knockouts in his paper were tiny changes in a few very short sequences — even if we had somehow been so confused that we though enhancer elements were junk, whittling away at such minuscule fragments of the genome weren’t going to appreciably increase the fraction that is labeled functional. That focus on finding more functionality in the genome flags Visel as yet another ENCODE acolyte.
Man, I’m feeling like ENCODE has led to a net increase in ignorance about biology.
Graur does not mince words in his assessment:
My problem is that junk DNA does not equal noncoding or nontranscribed DNA, and I am sort of sick to see junk DNA being buried, dismissed, rendered obsolete, eulogized, and killed twice a week. After all, your findings have no bearing on the vast majority of the genome, which as far as I am concerned is junk. Turning the genome into a well oiled efficient machine in which every last nucleotide has a function is the dream of every creationist and IDiot (intelligent designer), so the frequent killing of junk DNA serves no good purpose. Especially, since the evidence for function at present is at most 9% of the human genome. Why not call noncoding DNA noncoding DNA? After all, if a DNA segment has a function it is no junk.
Larry Moran is also a bit peeved, and explains that we actually know what a lot of that noncoding DNA does. It’s not a magic reservoir of hidden functionality.
I’ve said it many times but it bears repeating. A small percentage (about 1.4%) of our genome encodes proteins. There are many other interesting regions in our genome including …
- ribosomal RNA genes
- tRNA genes
- genes for small RNAs (e.g spliceosome RNAs, P1 RNA, 7SL RNA, linc RNA etc.)
- 5′ and 3′ UTRs in exons
- centromeres
- introns
- telomeres
- SARs (scaffold attachment regions)
- origins of DNA replication
- regulatory regions of DNA
- transposons (SINES, noncoding regions of LINES, LTRs)
- pseudogenes
- defective transposons
These parts of noncoding DNA accounts for about 80% of the human genome. A lot of this noncoding DNA is functional (about 7% of the total genome [What’s in Your Genome?]). None of it is mysterious in any way. We’ve known about it for decades. As Dan Graur says, it’s a known known.
At least I’m in a position to do a little something about this ignorance. I’m teaching cell biology to our sophomores this semester, and next week I start the section on DNA replication, with transcription the week after. My students will know the meanings of all those terms and have a clear picture of genome organization.
And what that should tell all you employers out there is that you should hire UMM biology graduates, because they’ll actually have some knowledge of the science. Unlike certain people who seem to have no problem publishing in Science and Nature.

So Oakley makes a line of sunglasses that they bill as “Asian fit”, that they’re designed for the parameters of the Asian face. This article concludes that Oakley’s “Asian fit” sunglasses aren’t racist, just science, but the data given don’t really support that claim.
The obvious problems are that 1) “Asian” doesn’t describe any kind of morphological uniformity, and 2) it’s not clear that the range of variation in facial structure is sufficiently distinct. Sure, the human brain is really good at discriminating racial groups, and there are obviously general differences, but Indian/Korean/Chinese/Japanese/Thai/etc. have subtle differences in their features, too, so why are they all being lumped together? And further, the parameters that vary and that might affect the fit of a pair of glasses seem to show a lot of overlap with other groups. For instance, the article shows one morphological parameter, nasal height, and how it varies in different racial groups.
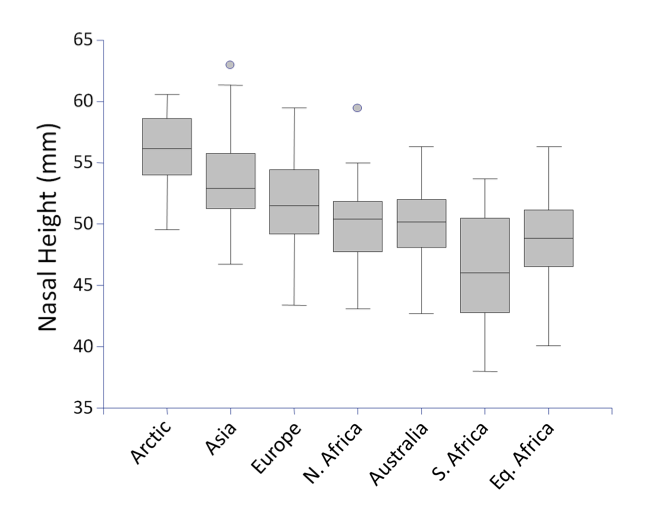
Whoa, look at the range in each of those groups: you would think that there might be some people of European ancestry who could use “Asian fit” glasses (with the caveat that this is one parameter, and there could be consistent patterns of covariation with others that reduce overlap).
As the article goes on to say, other companies than Oakley don’t make the Asian distinction at all, just producing a range of glasses that just fit. That seems like the wiser choice.