The true story of the Archaean genetic expansion

i-e88a953e59c2ce6c5e2ac4568c7f0c36-rb.png

I’ve been giving talks at scientific meetings on educational outreach — I’ve been telling the attendees that they ought to start blogs or in other ways make more of an effort to educate the public. I mentioned one successful result the other day, but we need more.

I give multiple reasons for scientists to do this. One is just general goodness: we need to educate a scientifically illiterate public. Of course, like all altruism, this isn’t really recommended out of simple kindness, but because the public ultimately holds the pursestrings, and science needs their understanding and support. Another reason, though, is personal. Scientific results get mangled in press releases and news accounts, so having the ability to directly correct misconceptions about your work ought to be powerfully attractive. Even worse, though, I tell them that creationists are actively distorting their work. This goes beyond simple ignorance and incomprehension into the malign world of actively lying about the science, and it happens more often than most people realize.

I have another painful example of deviousness of creationists. There’s a paper I’ve been meaning to write up for a little while, a Nature paper by David and Alm that reveals an ancient period of rapid gene expansion in the Archaean, approximately 3 billion years ago. Last night I thought I’d just take a quick look to see if anybody had already written it up, so I googled “Archaean genetic expansion,” and there it was: a couple of references to the paper itself, a news summary, one nice science summary, and…two creationist distortions of the paper, right there on the first page of google results. I told you! This happens all the time: if there’s a paper in one of the big journals that discusses more evidence for evolution, there is a creationist hack somewhere who’ll quickly write it up and lie about it. It’s a heck of a lot easier to summarize a paper if you don’t understand it, you see, so they’ve got an edge on us.

One of the creationist summaries is by an intelligent design creationist. He looks at the paper and claims it supports this silly idea called front-loading: the Designer seeded the Earth with creatures that carried a teleological evolutionary program, loading them up with genes at the beginning that would only find utility later. The unsurprising fact that many gene families are of ancient origin seems to him to confirm his weird idea of a designed source, when of course it does nothing of the kind, and fits quite well in an evolutionary history with no supernatural interventions at all.

The other creationist summary is from an old earth biblical creationist who tries to claim that “explosive increase in biochemical capabilities happened in anticipation of changes that were to take place in the environment”, a conclusion completely unsupportable from the paper, and also tries to telescope a long series of changes documented in the data into a single ancient event so that they can claim that the rate of innovation was so rapid that it contradicts the “evolutionary paradigm”.

So lets take a look at the actual paper. Does it defy evolutionary theory in any way? Does it actually make predictions that fit creationist models? The answer to both is a loud “NO”: it is a paper using methods of genomic analysis that produce evolutionary histories, it describes long periods of gradual modification of genomes, and it correlates genomic innovations with changes in the ancient environment. It is freakin’ bizarre that anyone can look at this work and think it supports creationism, but there you are, standard operating procedure in the fantasy world of the creationist mind.

Here’s the abstract, so you can get an idea of the conclusions the authors draw from the work.

The natural history of Precambrian life is still unknown because of the rarity of microbial fossils and biomarkers. However, the composition of modern-day genomes may bear imprints of ancient biogeochemical events. Here we use an explicit model of macro- evolution including gene birth, transfer, duplication and loss events to map the evolutionary history of 3,983 gene families across the three domains of life onto a geological timeline. Surprisingly, we find that a brief period of genetic innovation during the Archaean eon, which coincides with a rapid diversification of bacterial lineages, gave rise to 27% of major modern gene families. A functional analysis of genes born during this Archaean expan- sion reveals that they are likely to be involved in electron-transport and respiratory pathways. Genes arising after this expansion show increasing use of molecular oxygen (P=3.4 x 10⁻⁸) and redox- sensitive transition metals and compounds, which is consistent with an increasingly oxygenating biosphere.

This work is an analysis of the distribution of gene families in modern species. Gene families, if you’re unfamiliar with the term, are collections of genes that have similar sequences and usually similar functions that clearly arose by gene duplications. A classic example of a gene family are the globin genes, an array of very similar genes that produce proteins that are all involved in the transport of oxygen; they vary by, for instance, their affinity for oxygen, so there is a fetal hemoglobin which binds oxygen more avidly than adult hemoglobin, necessary so the fetus can extract oxygen from the mother’s circulatory system.

So, in this paper, David and Alm are just looking at genes that have multiple members that arose by gene duplication and divergence. They explicitly state that they excluded singleton genes, things called ORFans, which are unique genes within a lineage. That does mean that their results underestimate the production of novel genes in history, but it’s a small loss and one the authors are aware of.

If we were looking for evidence for evolution, we might as well stop here. The existence of gene families, for cryin’ out loud, is evidence for evolution. This paper is far beyond arguing about the truth of evolution — that’s taken for granted as the simple life’s breath of biology — but instead asks a more specific question: when did all of these genes arise? And they have a general method for estimating that.

Here’s how it works. If, for example, we have a gene family that is only found in animals, but not in fungi or plants or protists or bacteria, we can estimate the date of its appearance to a time shortly after the divergence of the animal clade from all those groups. If a gene family is found in plants and fungi and animals, but not in bacteria, we know it arose farther back in the past than the animal-only gene families, but not so far back as a time significantly predating the evolution of multicellularity.

Similarly, we can also look at gene losses. If a gene family or member of a gene family is present in the bacteria, and also found in animals, we can assume it is ancient in origin and common; but if that same family is missing in plants, we can detect a gene loss. Also, if the size of the gene family changes in different lineages, we can estimate rates of gene loss and gene duplication events.

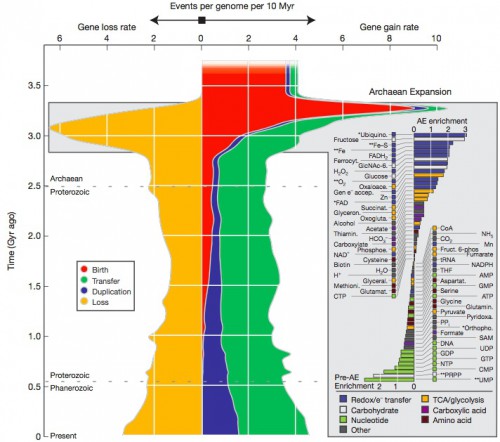
I’ve given greatly simplified examples, but really, this is a non-trivial exercise, requiring comparisons of large quantities of data and also analysis from the perspective of the topologies of trees derived from that data. The end result is that each gene family can be assigned an estimated date of origin, and that further, we can estimate how rapidly new genes were evolving over time, and put it into a rather spectacular graph.


(Click for larger image)
Rates of macroevolutionary events over time. Average rates of gene birth (red), duplication (blue), HGT (green), and loss (yellow) per lineage (events per 10 Myr per lineage) are shown. Events that increase gene count are plotted to the right, and gene loss events are shown to the left. Genes already present at the Last Universal Common Ancestor are not included in the analysis of birth rates because the time over which those genes formed is not known. The Archaean Expansion (AE) was also detected when 30 alternative chronograms were considered. The inset shows metabolites or classes of metabolites ordered according to the number of gene families that use them that were born during the Archaean Expansion compared with the number born before the expansion, plotted on a log2 scale. Metabolites whose enrichments are statistically significant at a false discovery rate of less than 10% or less than 5% (Fisher’s Exact Test) are identified with one or two asterisks, respectively. Bars are coloured by functional annotation or compound type (functional annotations were assigned manually). Metabolites were obtained from the KEGG database release 51.0 and associated with clusters of orthologous groups of proteins (COGs) using the MicrobesOnline September 2008 database28. Metabolites associated with fewer than 20 COGs or sharing more than two- thirds of gene families with other included metabolites are omitted.

Look first at just the red areas. That’s a measure of the rate of novel gene formation, and it shows a distinct peak early in the history of life, around 3 billion years ago. 27% of our genes are very, very old, arising in this first early flowering. Similarly, there’s a slightly later peak of gene loss, the orange area. This represents a period of early exploration and experimentation, when the first crude versions of the genes we use now were formed, tested, discarded if inefficient, and honed if advantageous.

But then the generation of completely novel genes drops off to a low to nonexistent rate (but remember, this is an underestimate because ORFans aren’t counted). If you draw any conclusions from the graph, it’s that life on earth was essentially done generating new genes about one billion years ago…but we know that all the multicellular diversity visible to our eyes arose after that period. What gives?

That’s what the blue and green areas tell us. We live in a world now rich in genetic diversity, most of it in the bacterial genomes, and our morphological diversity isn’t a product so much of creating completely new genes, but of taking existing, well-tested and functional genes and duplicating them (blue) or shuffling them around to new lineages via horizontal gene transfer (green). This makes evolutionary sense. What will produce a quicker response to changing conditions, taking an existing circuit module off the shelf and repurposing it, or shaping a whole new module from scratch through random change and selection?

This diagram gives no comfort to creationists. Look at the scale; each of the squares in the chart represents a half billion years of time. The period of rapid bacterial cladogenesis that produced the early spike is between 3.3 and 2.9 billion years ago — this isn’t some brief, abrupt creation event, but a period of genetic tinkering sprawling over a period of time nearly equal to the entirety of the vertebrate fossil record of which we are so proud. And it’s ongoing! The big red spike only shows the initial period of recruitment of certain genetic sequences to fill specific biochemical roles — everything that follows testifies to 3 billion years of refinement and variation.

The paper takes another step. Which genes are most ancient, which are most recent? Can we correlate the appearance of genetic functions to known changes in the ancient environment?

the metabolites specific to the Archaean Expansion (positive bars in Fig. 2 inset) include most of the compounds annotated as redox/e transfer (blue bars), with Fe-S-binding, Fe-binding and O2-binding gene families showing the most significant enrichment (false discovery rate<5%, Fisher’s exact test). Gene families that use ubiquinone and FAD (key metabolites in respiration pathways) are also enriched, albeit at slightly lower significance levels (false discovery rate<10%). The ubiquitous NADH and NADPH are a notable exception to this trend and seem to have had a function early in life history. By contrast, enzymes linked to nucleotides (green bars) showed strong enrichment in genes of more ancient origin than the expansion.

The observed bias in metabolite use suggests that the Archaean Expansion was associated with an expansion in microbial respiratory and electron transport capabilities.

So there is a coherent pattern: genes involved in DNA/RNA are even older than the spike (vestiges of the RNA world, perhaps?), and most of the genes associated with the Archaean expansion are associated with cellular metabolism, that core of essential functions all extant living creatures share.

Were we done then, as the creationists would like to imply? No. The next major event in the planet’s history is called the Great Oxygenation Event, in which the fluorishing bacterial populations gradually changed the atmosphere, excreting more and more of that toxic gas, oxygen.

What happened next was a shift in the kinds of novel genes that appeared: these newer genes were involved in oxygen metabolism and taking advantage of the changing chemical constituents of the ocean.

Our metabolic analysis supports an increasingly oxygenated biosphere after the Archaean Expansion, because the fraction of proteins using oxygen gradually increased from the expansion to the present day. Further indirect evidence of increasing oxygen levels comes from compounds whose availability is sensitive to global redox potential. We observe significant increases over time in the use of the transition metals copper and molybdenum, which is in agreement with geochemical models of these metals’ solubility in increasingly oxidizing oceans and with molybdenum enrichments from black shales suggesting that molybdenum began accumulating in the oceans only after the Archaean eon16. Our prediction of a significant increase in nickel utilization accords with geochemical models that predict a tenfold increase in the concentration of dissolved nickel between the Proterozoic eon and the present day but conflicts with a recent analysis of banded iron formations that inferred monotonically decreasing maximum concentrations of dissolved nickel from the Archaean onwards. The abundance of enzymes using oxidized forms of nitrogen (N2O and NO3) also grows significantly over time, with one-third of nitrate-binding gene families appearing at the beginning of the expansion and three-quarters of nitrous-oxide-binding gene families appearing by the end of the expansion. The timing of these gene-family births provides phylogenomic evidence for an aerobic nitrogen cycle by the Late Archaean.

So I don’t get it. I don’t see how anyone can look at that diagram, with its record of truly ancient genomic changes and its evidence of the steady acquisition of new abilities correlated with changes in the environment of the planet, and declare that it supports a creation event or front-loading of biological potential in ancestral populations. That makes no sense. This is work that shouts “evolution” at every instant, yet some people want to pretend it’s an endorsement of theological hocus-pocus? Madness.

Scientists, you need to be aware of this. The David and Alm paper is an unambiguously evolutionary paper, using genomic data to describe evolutionary events via evolutionary mechanisms, and the creationists still appropriate and abuse it. If you publish anything about evolution, be sure to google your paper periodically — you may find that you’ve been unwittingly roped into endorsing creationism.


David LA, Alm EJ (2011) Rapid evolutionary innovation during an Archaean genetic expansion. Nature 469(7328):93-6.

How to afford a big sloppy genome

i-e88a953e59c2ce6c5e2ac4568c7f0c36-rb.png

My direct experience with prokaryotes is sadly limited — while our entire lives and environment are profoundly shaped by the activity of bacteria, we rarely actually see the little guys. The closest I’ve come was some years ago, when I was doing work on grasshopper embryos, and sterile technique was a pressing concern. The work was done under a hood that we regularly hosed down with 95% alcohol, we’d extract embryos from their eggs, and we’d keep them alive for hours to days in tissue culture medium — a rich soup of nutrients that was also a ripe environment for bacterial growth. I was looking at the development of neurons, so I’d put the embryo under a high-powered lens of a microscope equipped with differential interference contrast optics, and the sheet of grasshopper neurons would look like a giant’s causeway, a field of tightly packed rounded boulders. I was watching processes emerging and growing from the cells, so I needed good crisp optics and a specimen that would thrive healthily for a good long period of time.

It was a bad sign when bacteria would begin to grow in the embryo. They were visible like grains of rice among the ripe watermelons of the cells I was interested in, and when I spotted them I knew my viewing time was limited: they didn’t obscure much directly, but soon enough the medium would be getting cloudy and worse, grasshopper hemocytes (their immune cells) would emerge and do their amoeboid oozing all over the field, engulfing the nasty bacteria but also obscuring my view.

What was striking, though, was the disparity in size. Prokaryotic bacteria are tiny, so small they nestled in the little nooks between the hopper cells; it was like the opening to Star Wars, with the tiny little rebel corvette dwarfed by the massive eukaryotic embryonic cells that loomed vastly in the microscope, like the imperial star destroyer that just kept coming and totally overbearing the smaller targets. And the totality of the embryo itself — that’s no moon. It’s a multicellular organism.

I had to wonder: why have eukaryotes grown so large relative to their prokaryotic cousins, and why haven’t any prokaryotes followed the strategy of multicellularity to build even bigger assemblages? There is a pat answer, of course: it’s because prokaryotes already have the most successful evolutionary strategy of them all and are busily being the best microorganisms they can be. Evolving into a worm would be a step down for them.

That answer doesn’t work, though. Prokaryotes are the most numerous, most diverse, most widely successful organisms on the planet: in all those teeming swarms and multitudinous opportunities, none have exploited this path? I can understand that they’d be rare, but nonexistent? The only big multicellular organisms are all eukaryotic? Why?

Another issue is that it’s not as if eukaryotes carry around fundamentally different processes: every key innovation that allowed multicellularity to occur was first pioneered in prokaryotes. Cell signaling? Prokaryotes have it. Gene regulation? Prokaryotes have that covered. Functional partitioning of specialized regions of the cell? Common in prokaryotes. Introns, exons, endocytosis, cytoskeletons…yep, prokaryotes had it first, eukaryotes have simply elaborated upon them. It’s like finding a remote tribe that has mastered all the individual skills of carpentry — nails and hammers, screws and screwdrivers, saws and lumber — as well as plumbing and electricity, but no one has ever managed to bring all the skills together to build a house.

Nick Lane and William Martin have a hypothesis, and it’s an interesting one that I hadn’t considered before: it’s the horsepower. Eukaryotes have a key innovation that permits the expansion of genome complexity, and it’s the mitochondrion. Without that big powerplant, and most importantly, a dedicated control mechanism, prokaryotes can’t afford to become more complex, so they’ve instead evolved to dominate the small, fast, efficient niche, leaving the eukaryotes to occupy the grandly inefficient, elaborate sloppy niche.

Lane and Martin make their case with numbers. What is the energy budget for cells? Somewhat surprisingly, even during periods of rapid growth, bacteria sink only about 20% of their metabolic activity into DNA replication; the costly process is protein synthesis, which eats up about 75% of the energy budget. It’s not so much having a lot of genes in the genome that is expensive, it’s translating those genes into useful protein products that costs. And if a bacterium with 4400 genes is spending that much making them work, it doesn’t have a lot of latitude to expand the number of genes — double them and the cell goes bankrupt. Yet eukaryotic cells can have ten times that number of genes.

Another way to look at it is to calculate the metabolic output of the typical cell. A culture of bacteria may have a mean metabolic rate of 0.2 watts/gram; each cell is tiny, with a mass of 2.6 x 10-12g, which means each cell is producing about 0.5 picowatts. A eukaryotic protist has about the same power output per unit weight, 0.06 watts/gram, but each cell is so much larger, about 40,000 x 10-12g, that a single cell has about 2300 picowatts available to it. So, more energy!

Now the question is how that relates to genome size. If the prokaryote has a genome that’s about 6 megabases long, that means it has about 0.08 picowatts/megabase to spare. If the eukaryote genome is 3,000 megabytes long, that translates into about 0.8 picowatts of power per megabase (that’s a tenfold increase, but keep in mind that there is wide variation in size in both prokaryotes and eukaryotes, so the ranges overlap and we can’t actually consider this a significant difference — they’re in the same ballpark).

Now you should be thinking…this is just a consequence of scaling. Eukaryotic power production per gram isn’t any better than what prokaryotes do, all they’ve done is made their cells bigger, and there’s nothing to stop prokaryotes from growing large and doing the same thing. In fact, they do: the largest known bacterium, Thiomargarita, can reach a diameter of a half-millimeter. It gets more metabolic power in a similar way to how eukaryotes do it: we eukaryotes carry a population of mitochondria with convoluted membranes and a dedicated strand of DNA, all to produce energy, and the larger the cell, the more mitochondria are present. Thiomargarita doesn’t have mitochondria, but it instead duplicates its own genome many times over, with 6,000-17,000 nucleoids distributed around the cell, each regulating its own patch of energy-producing membrane. It’s functionally equivalent to the eukaryotic mitochondrial array then, right?

Wrong. There’s a catch. Mitochondria have grossly stripped down genomes, carrying just a small cluster of genes essential for ATP production. One hypothesis for why this mitochondrial genome is maintained is that it acts as a local control module, rapidly responding to changes in the local membrane to regulate the structure. In Thiomargarita, in order to get this fine-tuned local control, the whole genome is replicated, dragging along all the baggage, and metabolic expense, of all of those non-metabolic genes.

Because it is amplifying the entire genomic package instead of just an essential metabolic subset, Thiomargarita‘s energy output per gene plummets in comparison. That difference is highlighted in this illustration which compares an ‘average’ prokaryote, Escherichia, to a giant prokaryote, Thiomargarita, to an ‘average’ eukaryotic protist, Euglena.

i-3ec4f5c02d3305d25182f69119307702-cellpower-thumb-400x336-59593.jpeg
(Click for larger image)

The cellular power struggle. a-c, Schematic representations of a medium sized prokaryote (Escherichia), a very large prokaryote (Thiomargarita), and a medium-sized eukaryote (Euglena). Bioenergetic membranes across which chemiosmotic potential is generated and harnessed are drawn in red and indicated with a black arrow; DNA is indicated in blue. In c, the mitochondrion is enlarged in the inset, mitochondrial DNA and nuclear DNA are indicated with open arrows. d-f, Power production of the cells shown in relation to fresh weight (d), per haploid gene (e) and per haploid genome (power per haploid gene times haploid gene number) (f). Note that the presence or absence of a nuclear membrane in eukaryotes, although arguably a consequence of mitochondrial origin70, has no impact on energetics, but that the energy per gene provided by mitochondria underpins the origin of the genomic complexity required to evolve such eukaryote-specific traits.

Notice that the prokaryotes are at no disadvantage in terms of raw power output; eukaryotes have not evolved bigger, better engines. Where they differ greatly is in the amount of power produced per gene or per genome. Eukaryotes are profligate in pouring energy into their genomes, which is how they can afford to be so disgracefully inefficient, with numerous genes with only subtle differences between them, and with large quantities of junk DNA (which is also not so costly anyway; remember, the bulk of the expense is in translating, not replicating, the genome, and junk DNA is mostly untranscribed).

So, what Lane and Martin argue is that the segregation of energy production into functional modules with an independent and minimal genetic control mechanism, mitochondria with mitochondrial DNA, was the essential precursor to the evolution of multicellular complexity — it’s what gave the cell the energy surplus to expand the genome and explore large-scale innovation.

As they explain it…

Our considerations reveal why the exploration of protein sequence space en route to eukaryotic complexity required mitochondria. Without mitochondria, prokaryotes—even giant polyploids—cannot pay the energetic price of complexity; the lack of true intermediates in the prokaryote-to-eukaryote transition has a bioenergetic cause. The conversion from endosymbiont to mitochondrion provided a freely expandable surface area of internal bioenergetic membranes, serviced by thousands of tiny specialized genomes that permitted their host to evolve, explore and express massive numbers of new proteins in combinations and at levels energetically unattainable for its prokaryotic contemporaries. If evolution works like a tinkerer, evolution with mitochondria works like a corps of engineers.

That last word is unfortunate, because they really aren’t saying that mitochondria engineer evolutionary change at all. What they are is permissive: they generate the extra energy that allows the nuclear genome the luxury of exploring a wider space of complexity and possible solutions to novel problems. Prokaryotes are all about efficiency and refinement, while eukaryotes are all about flamboyant experimentation by chance, not design.


Lane N, Martin W. (2010) The energetics of genome complexity. Nature 467(7318):929-34.

The molecular foundation of the phylotypic stage

i-e88a953e59c2ce6c5e2ac4568c7f0c36-rb.png

When last we left this subject, I had pointed out that the phenomenon of embryonic similarity within a phylum was real, and that the creationists were in a state of dishonest denial, arguing with archaic interpretations while trying to pretend the observations were false. I also explained that constraints on morphology during development were complex, and that it was going to take something like a thorough comparative analysis of large sets of gene expression data in order to drill down into the mechanisms behind the phylotypic stage.

Guess what? The comparative analysis of large sets of gene expression data is happening. And the creationists are wrong, again.

Again, briefly, here’s the phenomenon we’re trying to explain. On the left in the diagram below is the ‘developmental hourglass’: if you compare eggs from various species, and adults from various species, you find a diversity of forms. However, at one period in early development called the phylytypic stage (or pharyngula stage specifically in vertebrates), there is a period of greater similarity. Something is conserved in animals, and it’s not clear what; it’s not a single gene or anything as concrete as a sequence, but is instead a pattern of interactions between developmentally significant genes.

i-447cbea02917160cf98ba765931eb172-raff_hourglass.gif

The diagram on the right is an explanation for the observations on the left. What’s going on in development is an increase in complexity over time, shown by the gray line, but the level of global interactions does not increase so simply. What this means is that in development, modular structures are set up that can develop autonomously using only local information; think of an arm, for instance, that is initiated as a limb bud and then gradually differentiates into the bones and muscle and connective tissue of the limb without further central guidance. The developing arm does not need to consult with the toes or get information from the brain in order to grow properly. However, at some point, the limb bud has to be localized somewhere specific in relation to the toes and brain; it does require some sort of global positioning system to place it in the proper position on the embryo. What we want to know is what is the GPS signal for an embryo: what it looks like is that that set of signals is generated at the phylotypic stage, and that’s why this particular stage is relatively well-conserved.

One important fact about the diagram above: the graph on the right is entirely speculative and is only presented to illustrate the concept. It’s a bit fake, too—the real data would have to involve multiple genes and won’t be reducible to a single axis over time in quite this same way.

Two recent papers in Nature have examined the real molecular information behind the phylotypic stage, and they’ve confirmed the molecular basis of the conservation. Of course, by “recent”, I mean a few weeks ago…and there have already been several excellent reviews of the work. Matthew Cobb has a nice, clean summary of both, if you just want to get straight to the answer. Steve Matheson has a three part series thoroughly explaining the research, so if you want all the details, go there.

In the first paper by Kalinka and others, the authors focused on 6 species of Drosophila that were separated by as much as 40 million years of evolution, and examined quantitative gene expression data for over 3000 genes measured at 2 hour intervals. The end result of all that work is a large pile of numbers for each species and each gene that shows how expression varies over time.

Now the interesting part is that those species were compared, and a measure was made of how much the expression varied: that is, if gene X in Drosophila melanogaster had the same expression profile as the homologous gene X in D. simulans, then divergence was low; if gene X was expressed at different times to different degrees in the two species, then divergence was high. In addition, the degree of conservation of the gene sequences between the species were also estimated.

The prediction was that there ought to be a reduction of divergence during the phylotypic period. That is, the expression of genes in these six species should differ the least in developmental genes that were active during that period. In addition, these same genes should show a greater degree of evolutionary constraint.

Guess what? That’s exactly what they do see.

i-2f9a2711e87bf8938f02d2324986ac61-fly_phylo.jpg
Temporal expression divergence is minimized during the phylotypic period. a, Temporal divergence of gene expression at individual time points during embryogenesis. The curve is a second-order polynomial that fits best to the divergence data. Embryo images are three-dimensional renderings of time-lapse embryonic development of D. melanogaster using Selective Plane Illumination Microscopy (SPIM).

That trough in the graph represents a period of reduced gene expression variance between the species, and it corresponds to that phylotypic period. This is an independent confirmation of the morphological evidence: the similarities are real and they are an aspect of a conserved developmental program.

By the way, this pattern only emerges in developmental genes. They also examined genes involved in the immune system and metabolism, for instance, and they show no such correlation. This isn’t just a quirk of some functional constraint on general gene expression at one stage of development, but realy is something special about a developmental and evolutionary constraint.

The second paper by Domazet-Loso and Tautz takes a completely different approach. They examine the array of genes expressed at different times in embryonic development of the zebrafish, and then use a comparative analysis of the sequences of those genes against the sequences of genes from the genomic databases to assign a phylogenetic age to them. They call this phylostratigraphy. Each gene can be dated to the time of its origin, and then we can ask when phylogenetically old genes tend to be expressed during development.

The prediction here is that there would be a core of ancient, conserved genes that are important in establishing the body plan, and that they would be expressed during the phylotypic stage. The divergence at earlier and later stages would be a consequence of more novel genes.

Can you guess what they saw? Yeah, this is getting predictable. The observed pattern fits the prediction.

i-7a95c0263441e0773dfd11e542e10053-zf_phylo-thumb-450x294-59556.jpeg
(Click for larger image)


Transcriptome age profiles for the zebrafish ontogeny. a, Cumulative transcriptome age index (TAI) for the different developmental stages. The pink shaded area represents the presumptive phylotypic phase in vertebrates. The overall pattern is significant by repeated measures ANOVA (P = 2.4 3 10-15, after Greenhouse-Geisser correction P = 0.024). Grey shaded areas represent ± the standard error of TAI estimated by bootstrap analysis.

So what does this all tell us? That the phylotypic stage can be observed and measured quantitatively using several different techniques; that it represents a conserved pattern of development gene expression; and that the genes involved are phylogenetically old (as we’d expect if they are conserved.)

Domazet-Loso and Tautz propose two alternative explanations for the phenomenon, one of which I don’t find credible.

Adaptations are expected to occur primarily in response to altered ecological conditions. Juvenile and adults interact much more with ecological factors than embryos, which may even be a cause for fast postzygotic isolation. Similarly, the zygote may also react to environmental constraints, for example, via the amount of yolk provided in the egg. In contrast, mid-embryonic stages around the phylotypic phase are normally not in direct contact with the environment and are therefore less likely to be subject to ecological adaptations and evolutionary change. As already suggested by Darwin, this alone could explain the lowered morphological divergence of early ontogenetic stages compared to adults, which would obviate the need to invoke particular constraints. Alternatively, the constraint hypothesis would suggest that it is difficult for newly evolved genes to become recruited to strongly connected regulatory networks.

They propose two alternatives, that the phylotypic stage is privileged and therefore isn’t being shaped by selection, or that it is constrained by the presence of a complicated gene network, and therefore is limited in the amount of change that can be tolerated. The first explanation doesn’t make sense to me: if a system is freed from selection, then it ought to diverge more rapidly, not less. I’m also baffled by the suggestion that the mid-stage embryos are not in direct contact with the environment. Of course they are…it’s just possible that that mid-development environment is more stable and more conserved itself.

What we need to know more about is the specifics of the full regulatory network. A map of the full circuitry, rather than just aggregate measures of divergence, would be nice. I’m looking forward to it!

The creationists aren’t, though.


Domazet-Loso, T., & Tautz, D. (2010). A phylogenetically based transcriptome age index mirrors ontogenetic divergence patterns. Nature 468 (7325): 815-818. DOI: 10.1038/nature09632

Kalinka, A., Varga, K., Gerrard, D., Preibisch, S., Corcoran, D., Jarrells, J., Ohler, U., Bergman, C., Tomancak, P. (2010). Gene expression divergence recapitulates the developmental hourglass model. Nature 468 (7325): 811-814 DOI: 10.1038/nature09634

Blaschko’s Lines

One of the subjects developmental biologists are interested in is the development of pattern. There are the obvious externally visible patterns — the stripes of a zebra, leopard spots, the ordered ranks of your teeth, etc., etc., etc. — and in fact, just about everything about most multicellular organisms is about pattern. Without it, you’d be an amorphous blob.

But there are also invisible patterns that you don’t normally see that are aspects of the process of assembly, the little seams and welds where disparate pieces of the organism are stitched together during development. The best known ones are compartment boundaries in insects. A fly’s wing, for instance, has a normally undetectable line running across the middle of it, a line that cells respect. A cell born on the front half of the wing will multiply and expand its progeny to cover a patch on the surface, but none of its offspring cells will cross over the invisible line into the back half. Similarly, cells born on the back half will never wander into the front.

We can see these invisible lines by taking advantage of mosaicism: generate a fly wing with two genetically distinct cell types, for instance by making one type express a pigment marker and the other not, and the boundaries become apparent. There are many ways we can generate mosaics, but in Drosophila we can use somatic recombination — with low frequency, chromosomes in the fly can undergo crossing over in mitosis, not just meiosis, so sometimes the swapping of chromosome segments will turn a daughter cell that should have been heterozygous for an allele into one that is homozygous, allowing a marker allele to express itself.

i-2f70a2ff4834b36200b3c0e67c9701e4-blas_dros_compartments-thumb-450x233-54592.jpeg
(Click for larger image)

(A) The shapes of marked clones in the Drosophila wing reveal the existence of a compartment boundary. The border of each marked clone is straight where it abuts the boundary. Even when a marked clone has been genetically altered so that it grows more rapidly than the rest of the wing and is therefore very large, it respects the boundary in the same way (drawing on right). Note that the compartment boundary does not coincide with the central wing vein. (B) The pattern of expression of the engrailed gene in the wing. The compartment boundary coincides with the boundary of engrailed gene expression.

It’s like a secret code written in molecules hidden to the eye until you illuminate it in just the right way to expose it. And these lines aren’t just arbitrary, they’re significant. The wing boundary defines the expression of important molecules that define the identity of specific structures. The posterior half of the wing is the domain of expression of a molecule called engrailed, which is part of the machinery that makes the back half a back half. We can also stain a wing for just that gene product, and also expose the hidden lines.

i-bdc64360d6b1c5ea5911e8248898977f-blas_dros_wing.jpeg

We can also mutate the pathway of which engrailed is part, and do interesting things to the fly wing, like turn the back half into a mirror image of the front half. So these lines actually matter for the proper development of a fly.

So you might be wondering if we have anything similar in humans…and no, we don’t have strict compartment boundaries like a fly. However, we do have normally invisible lines and stripes of subtle molecular differences running across our bodies, which are occasionally exposed by human mosaicism. These are marks called the lines of Blaschko, after the investigator who first reported a common set of patterns in patients with dermatological disorders in 1901.

Don’t rip off your shirt and start looking for the Blaschko lines — they’re almost always invisible, remember! What happens is that sometimes people with visible dermatological problems — rashes, peculiar pigmentation, swathes of moles, that sort of thing — express the problems in a stereotypically patterned way. On the back, there are V-shaped patterns; on the abdomen and chest, S-shaped swirls; and on the limbs, longitudinal streaks.

Here is the standard arrangement:

i-352b8c8940ae3412c1ea3d98aa8601e5-blaschko.jpeg

And here are a few examples:

i-83fe4ec386564e5ca9bd0caf2fa69dc9-blas_back.jpegi-372f6cbcc123892cbe750c377bf0c11e-blas_front.jpeg

Note that usually there isn’t a whole-body arrangement of tiger stripes everywhere — there may be a single band of peculiar skin that represents one part of the whole.

Where do these come from? The current hypothesis is that a patch of tissue that follows a Blaschko line represents a clone of cells derived from a single cell in the early embryo. These clones follow stereotypical expansion and migration patterns depending on their position in the embryo; this would suggest that a cell in the middle of the back of a tiny embryo, as it grows larger with the growing embryo, would tend to expand first upwards towards the head and then sweep backwards and around to the front. One way to think of it: imagine taking a piece of yellow clay and sandwiching it between two pieces of green clay into a block, and then pushing and stretching the clay block to make a human figurine. The yellow would make a band somewhere in the middle, all right, but it wouldn’t be a simple rectilinear slice anymore — it would express a more complex border that reflected the overall flow of the medium.

What makes the lines visible in some people? The likeliest example is mosaicism, a difference between two adjacent cells in the early embryo that then appears as a genetic difference in the expanded tissues. There are a couple of ways human beings can be mosaic.

The most common example is X-chromosome inactivation in women. Women have two X-chromosomes, but men only have one; to maintain parity in the regulation of expression of X-linked genes, women completely shut down one X. Which one is shut down is entirely random. That means, of course, that all women are mosaic, with different X-chromosomes shut down in different cells. This normally makes no difference, since equivalent alleles are present on each, but occasionally an X-linked skin disorder can manifest itself in a splotchy pattern. Another familiar example is the calico fur color in female cats, caused by the random expression of a pigment gene on the feline X chromosome.

A more spectacular example is tetragametic chimerism. This rare event is the result of the fusion of two non-identical twins at an early stage of development, producing an embryo that is a kind of salt-and-pepper mix of two individuals. After the fusion, the embryo develops normally as a single individual, but genetic or molecular tests can detect the patches of different genotypes. (No scientific tests can tell whether the individual has two souls, however.)

Another way differences can arise is by somatic mutation. Mutations occur all the time, not just in the germ line; we’re all a mixture of cells with slightly different mitotic histories and some of them contain novel mutations, usually not of a malign sort, or you wouldn’t be reading this right now. But what can happen is that you acquire a mutation in one cell that may predispose its clone of progeny to form moles, or acquire a skin disease, or even tilt it towards going cancerous. It’s a fine thing to undergo genetic screening to find that you may not carry certain alleles associated with cancer, but you aren’t entirely off the hook: you may have patches of tissue in your body that are perfectly normal and functional except that they carry an enabling mutation that occurred when you were an embryo.

One final likely mechanism is epigenetic. Throughout development, genes are switched on and off by epigenetic modification of the DNA. This process can vary: epigenetic silencing doesn’t have to be 0 or 100% absolute, but can differ in degree from cell to cell. It can also vary by chromosome — you’re all diploid, and epigenetic modification may affect one chromosome of a pair to a different degree than the other. Since epigenetic modifications are inherited by the progeny of a cell, that means these differences can be propagated into a clonal patch…that on the skin, will likely follow the lines of Blaschko.

Don’t fret over these lines; they aren’t a disease or a problem or even, in most cases, at all visible. The cool thing about them is that there is a hidden map of your secret history as an individual embedded in silent patterns in your skin — you were not defined as a single, simple, discrete genetic entity at fertilization, but are the product of complicated, subtle changes and errors and shufflings and sortings of cells. We’re all beautiful pointillist masterpieces.

Excellent interview with Craig Venter

Spiegel has a wonderful interview with Venter. The more I hear from Venter, the more I like him; he’s very much a no-BS sort of fellow. He’s the guy who really drove the human genome project to completion, and he’s entirely open about explaining that its medical significance was grossly overstated.

SPIEGEL: So the significance of the genome isn’t so great after all?

Venter: Not at all. I can tell you from my own experience. I put my own genome on the Internet. People had the notion this was the scariest thing out there. But what happened? Nothing.

There really was a lot of hysteria in the early days about how the insurance companies would abuse the information in the genome, and there was also the GATTACA dystopia. None of it has, and I daresay none of it will, come to pass.

Venter: That’s what you say. And what else have I learned from my genome? Very little. We couldn’t even be certain from my genome what my eye color was. Isn’t that sad? Everyone was looking for miracle ‘yes/no’ answers in the genome. “Yes, you’ll have cancer.” Or “No, you won’t have cancer.” But that’s just not the way it is.

SPIEGEL: So the Human Genome Project has had very little medical benefits so far?

Venter: Close to zero to put it precisely.

SPIEGEL: Did it at least provide us with some new knowledge?

Venter: It certainly has. Eleven years ago, we didn’t even know how many genes humans have. Many estimated that number at 100,000, and some went as high as 300,000. We made a lot of enemies when we claimed that there appeared to be considerably fewer — probably closer to the neighborhood of 40,000! And then we found out that there are only half as many. I was just in Stockholm for the 200th anniversary of the Karolinska Institute. The first presentation was about the many achievements the decoding of the genome has brought. Then I spoke and said that this century will be remembered for how little, and not how much, happened in this field.

Hmmm…I seem to recall that Venter’s company was one that was trying to patent an inflated number of genes, which contradicts what he’s claiming here. But otherwise, yes, the HGP isn’t yet a source of useful medical information, but it’s a trove of scientific information; I’d also add that the technology race put a lot of useful techniques in our hands.

Venter: Exactly. Why did people think there were so many human genes? It’s because they thought there was going to be one gene for each human trait. And if you want to cure greed, you change the greed gene, right? Or the envy gene, which is probably far more dangerous. But it turns out that we’re pretty complex. If you want to find out why someone gets Alzheimer’s or cancer, then it is not enough to look at one gene. To do so, we have to have the whole picture. It’s like saying you want to explore Valencia and the only thing you can see is this table. You see a little rust, but that tells you nothing about Valencia other than that the air is maybe salty. That’s where we are with the genome. We know nothing.

Exactly! Traits are products of overlapping networks of genes. Venter also explains that a lot of the effects of genes are developmental, so you can’t expect to be able to take a pill to correct something that went wrong in the assembly process in the embryo.

Here’s my favorite exchange from the interview.

Venter: Yes, and I find them frightening. I can read your genome, you know? Nobody’s been able to do that in history before. But that is not about God-like powers, it’s about scientific power. The real problem is that the understanding of science in our society is so shallow. In the future, if we want to have enough water, enough food and enough energy without totally destroying our planet, then we will have to be dependent on good science.

SPIEGEL: Some scientist don’t rule out a belief in God. Francis Collins, for example …

Venter: … That’s his issue to reconcile, not mine. For me, it’s either faith or science – you can’t have both.

SPIEGEL: So you don’t consider Collins to be a true scientist?

Venter: Let’s just say he’s a government administrator.

Oh, snap.

It’s more than genes, it’s networks and systems

i-e88a953e59c2ce6c5e2ac4568c7f0c36-rb.png

Most of you don’t understand evolution. I mean this in the most charitable way; there’s a common conceptual model of how evolution occurs that I find everywhere, and that I particularly find common among bright young students who are just getting enthusiastic about biology. Let me give you the Standard Story, the one that I get all the time from supporters of biology.

Evolution proceeds by mutation and selection. A novel mutation occurs in a gene that gives the individual inheriting it an advantage, and that person passes it on to their children who also gets the advantage and do better than their peers, and leave more offspring. Given time, the advantageous mutation spreads through the population so the entire species has it.

One example is the human brain. An ape man millions of years ago acquired a mutation that made his or her brain slightly larger, and since those individuals were slightly smarter than other ape men, it spread through the population. Then later, other mutations occured and were selected for and so human brains gradually got larger and larger.

You either know what’s wrong here or you’re feeling a little uneasy—I gave you enough hints that you know I’m going to complain about that story, but if your knowledge is at the Evolutionary Biology 101 level, you may not be sure what it is.

Just to make you even more queasy, the misunderstanding here is one that creationists have, too. If you’ve ever encountered the cryptic phrase “RM+NS” (“random mutation + natural selection”) used as a pejorative on a creationist site, you’ve found someone with this affliction. They’ve got it completely wrong.

Here’s the problem, and also a brief introduction to Evolutionary Biology 201.

First, it’s not exactly wrong — it’s more like taking one good explanation of certain kinds of evolution and making it a sweeping claim that that is how all evolution works. By reducing it to this one scheme, though, it makes evolution far too plodding and linear, and reduces it all to a sort of personal narrative. It isn’t any of those things. What’s left out in the 101 story, and in creationist tales, is that: evolution is about populations, so many changes go on in parallel; selectable traits are usually the product of networks of genes, so there are rarely single alleles that can be categorized as the effector of change; and genes and gene networks are plastic or responsive to the environment. All of these complications make the actual story more complicated and interesting, and also, perhaps to your surprise, make evolutionary change faster and more powerful.

Think populations

Mutations are the root of biological variation, of course, but we often have a naive view of their consequences. Most mutations are neutral. Even advantageous mutations are subject to laws of chance in their propagation, and a positive selection coefficient does not mean there will be an inexorable march to fixation, where every individual has the allele. This is also true of deleterious mutations: chance often dominates, and unless it is a strongly negative allele, like an embryonic lethal mutation, there’s also a chance it can spread through the population.

Stop thinking of mutations as unitary events that either get swiftly culled, because they’re deleterious, or get swiftly hauled into prominence by the uplifting crane of natural selection. Mutations are usually negligible changes that get tossed into the stewpot of the gene pool, where they simmer mostly unnoticed and invisible to selection. Look at human faces, for instance: they’re all different, and unless you’re looking at the extremes of beauty or ugliness, the variations simply don’t make much difference. Yet all those different faces really are the result of subtly different combinations of mutant forms of genes.

“Combinations” is the magic word. A single mutation rarely has a significant effect on a feature, but the combination of multiple mutations may have a detectable or even novel effect that can be seen by natural selection. And that’s what’s going on all the time: the population is a huge reservoir of genetic variation, and what we do when we reproduce is sort and mix and generate new combinations that are then tested in the environment.

Compare it to a game of poker. A two of hearts in itself seems to be a pathetic little card, but if it’s part of a flush or a straight or three of a kind, it can produce a winning hand. In the game, it’s not the card itself that has power, it’s its utility in a pattern or combination of other cards. A large population like ours is a great shuffler that is producing millions of new hands every day.

We know that this recombination is essential to the rapid acquisition of new phenotypes. Here are some results from a classic experiment by Waddington. Waddington noted that fruit flies expressed the odd trait of developing four wings (the bithorax phenotype) instead of two if they were exposed to ether early in development. This is not a mutation! This is called a phenocopy, where an environmental factor induces an effect similar to a genetic mutation.

What Waddington did next was to select for individuals that expressed the bithorax phenotype most robustly, or that were better at resisting the ether, and found that he could get a progressive strengthening of the response.

i-b7d71dfe023865cd8212e074b3e018b3-bithorax.jpeg
The progress of selection for or against a bithorax-like response to ether treatment in two wild-type populations. Experiments 1 and 2 initially showed about 25 and 48% of the bithorax (He) phenotype.

This occurred over 10s of generations — far, far too fast for this to be a consequence of the generation of new mutations. What Waddington was doing was selecting for more potent combinations of alleles already extant in the gene pool.

This was confirmed in a cool way with a simple experiment: the results in the graph above were obtained from wild-caught populations. Using highly inbred laboratory strains that have greatly reduced genetic variation abolishes the outcome.

Jonathan Bard sees this as a powerful potential factor in evolution.

Waddington’s results have excited considerable controversy over the years, for example as to whether they reflect threshold effects or hidden variation. In my view, these arguments are irrelevant to the key point: within a population of organisms, there is enough intrinsic variability that, given strong selection pressures, minor but existing variants in a trait that are not normally noticeable can rapidly become the majority phenotype without new mutations. The implications for evolution are obvious: normally silent mutations in a population can lead to adaptation if selection pressures are high enough. This view provides a sensible explanation of the relatively rapid origins of the different beak morphologies of Darwin’s various finches and of species flocks.

Think networks

One question you might have at this point is that the model above suggests that mutations are constantly being thrown into the population’s gene pool and are steadily accumulating — it means that there must be a remarkable amount of genetic variation between individuals (and there is! It’s been measured), yet we generally don’t see most people as weird and obvious mutants. That variation is largely invisible, or represents mere minor variations that we don’t regard as at all remarkable. How can that be?

One important reason is that most traits are not the product of single genes, but of combinations of genes working together in complex ways. The unit producing the phenotype is most often a network of genes and gene products, such at this lovely example of the network supporting expression and regulation of the epidermal growth factor (EGF) pathway.

That is awesomely complex, and yes, if you’re a creationist you’re probably wrongly thinking there is no way that can evolve. The curious thing is, though, that the more elaborate the network, the more pieces tangled into the pathway, the smaller the effect of any individual component (in general, of course). What we find over and over again is that many mutations to any one component may have a completely indetectable effect on the output. The system is buffered to produce a reliable yield.

This is the way networks often work. Consider the internet, for example: a complex network with many components and many different routes to get a single from Point A to Point B. What happens if you take out a single node, or even a set of nodes? The system routes automatically around any damage, without any intelligent agency required to consciously reroute messages.

But further, consider the nature of most mutations in a biological network. Simple knockouts of a whole component are possible, but often what will happen are smaller effects. These gene products are typically enzymes; what happens is a shift in kinetics that will more subtly modify expression. The challenge is to measure and compute these effects.

Graph analysis is showing how networks can be partitioned and analysed, while work on the kinetics of networks has shown first that it is possible to simplify the mathematics of the differential equation models and, second, that the detailed output of a network is relatively insensitive to changes in most of the reaction parameters. What this latter work means is that most gene mutations will have relatively minor effects on the networks in which their proteins are involved, and some will have none, perhaps because they are part of secondary pathways and so redundant under normal circumstances. Indirect evidence for this comes from the surprising observation that many gene knockouts in mice result in an apparently normal phenotype. Within an evolutionary context, it would thus be expected that, across a population of organisms, most
mutations in a network would effectively be silent, in that they would give no selective advantage under normal conditions. It is one of the tasks of systems biologists to understand how and where mutations can lead to sufficient variation in networks properties for selection to have something on which to act.

Combine this with population effects. The population can accumulate many of these sneaky variants that have no significant effect on most individuals, but under conditions of strong selection, combinations of these variants, that together can have detectable effects, can be exposed to selection.

Think flexible genes

Another factor in this process (one that Bard does not touch on) is that the individual genes themselves are not invariant units. Mutations can affect how genes contribute to the network, but in addition, the same allele can have different consequences in different genetic backgrounds — it is affected by the other genes in the network — and also has different consquences in different external environments.

Everything is fluid. Biology isn’t about fixed and rigidly invariant processes — it’s about squishy, dynamic, and interactive stuff making do.

Now do you see what’s wrong with the simplistic caricature of evolution at the top of this article? It’s superficial; it ignores the richness of real biology; it limits and constrains the potential of evolution unrealistically. The concept of evolution as a change in allele frequencies over time is one small part of the whole of evolutionary processes. You’ve got to include network theory and gene and environmental interactions to really understand the phenomena. And the cool thing is that all of these perspectives make evolution an even more powerful force.


Bard J (2010) A systems biology view of evolutionary genetics. Bioessays 32: 559-563.

An unpaleontological lament for lost molecules and shattered cells and the cruelty of time

i-e88a953e59c2ce6c5e2ac4568c7f0c36-rb.png

Sometimes, I really hate fossils. I hate them with the passion of a spurned lover, one who is consumed with desire but knows that he will never, ever be satisfied. They drive me mad.

Right now we’re at a point in our technology where we can take a small sample from a living organism and break it down into amazing detail — we can extract every gene, throw them into a computer, and compare them with every other gene that has been similarly sampled. We can look for the scars of evolution, we can analyze and figure out where on the tree of life this cell resides, we can even figure out what local populatons it lived in, who its ancestors bred with, and to a certain extent, what various alleles contributed to its form and physiology. We don’t know everything, but every time someone works out some new detail in a related species, it goes into the databases and presto, the information cascades through every other relative. I’d call it magic, but that would insult the science with cheap understatement.

We can’t do that with most fossils (with some recent exceptions). The cells are gone. Their contents are obliterated — DNA fragmented, dissolved, corrupted, lost. And the farther back in time we go, the less information we have, but the more interesting the problems become.

All organisms are built of cells — they’re like the Lego building blocks of biology, with specific features that snap them together. With Legos, of course, you can build all kinds of different forms: stick them together and build a Lego Triceratops or a Lego T. rex. Different on the outside, different in arrangement, different in pattern, but all fundamentally built of the same kinds of blocks. I can get into the coolness of digging up a Triceratops or a T. rex, but these are all variations on a theme of phylum Chordata, superclass Tetrapoda, and they’re all using the same building blocks, and all the really interesting stuff, the details in the genome that make one morphology different than another, have all been bled out on the sands of time and gnawed by all-devouring bacteria and reduced to at best a non-specific smear of carbon. That makes me frustrated.

Even worse, most familiar fossils are big bony animals — they’re all pretty much the same, deep down. If they’re built of Legos, there are whole other clades of multicellular organisms that are the equivalent of meccano, lincoln logs, Capsela, and tinkertoys. How were they put together? And how did they evolve these different patterns of connections? To know that, we have to go way back into deep time, and look at the unicellular organisms, the cells that first pioneered patterns of interactions and laid down the possible rules of development that enabled big clumsy multicellular to accumulate the bulk that made them more likely to be fossilized. Those pioneers are practically nonexistent in the fossil record.

What prompts my lament for lost cells is this recent amazing discovery: a collection of fossilized multicellular organisms unearthed in Gabon that are 2.1 billion years old. Keep in mind that in comparison, the Cambrian explosion, the event that was the root of familiar animal diversity, was a mere half billion years ago, so these are genuinely ancient. They’re also beautiful.

i-fcc88213964aed91cefd444a1530f14d-gabon_fossils-thumb-400x525-53117.jpg
(Click for larger image)

Samples show a disparity of forms based on: external size and shape characteristics; peripheral radial microfabric (missing in view d); patterns of topographic thickness distribution; general inner structural organization, including occurrence of folds (seen in views b and c) and of a nodular pyrite concretion in the central part of the fossil (absent in views a and b). a, Original specimen. b, Volume rendering in semi-transparency. c, Transverse (axial) two-dimensional section. d, Longitudinal section running close to the estimated central part of the specimen. Scale bars, 5 mm. Specimens from top to bottom: G-FB2-f-mst1.1, G-FB2-f-mst2.1, G-FB2-f-mst3.1, G-FB2-f-mst4.1.

These small, flat, furrowed sheets lived at a kind of temporal boundary, a few hundred million years after a rise in atmospheric oxygen called the Great Oxygenation Event — a crisis in the history of life on earth which occured when the production of oxygen by photosynthetic organisms could no longer be buffered by reacting chemically with minerals, and began to build up in the atmosphere. This was catastrophic for most of the organisms living at that time, which were anaerobic and found oxygen to be a caustic poison. It was an advantage to a subset that adapted to use oxygen as a fuel in chemical reactions, though, so there was also the beginnings of new forms which exploited this newly oxygenated atmosphere. That’s where these mysterious blobs come in; they were found in formations that had a chemical signature indicating the presence of free oxygen.

These were almost certainly colonial organisms that took advantage of the higher concentration of oxygen to build denser mats on top of the sea floor. They probably weren’t true multi-cellular organisms; they were a step up from a colony of bacteria that you might see growing on a petri dish, but with additional molecular features that permitted greater coordination and the development of more elaborate spatial patterning.

We also know that these had to have been very different from organisms that exist now. Those are not animals, they are not plants, they are not fungi — they are something primeval and radically different, organisms that most likely do not have any living descendants. Those are real aliens in the photo above. There is no category in your experience which you can put them into.

It’s what we don’t know that inflames my curiousity. One of the other things that was going on during the Great Oxygenation Event was the steady loss of dissolved iron in the seas — it was all being oxidized, rusted out, and precipitating out, forming geological structures like the banded iron formations. It was also facilitating the preservation of these organisms by pyritizing them — all their soft gooey bits, the whole of creature, were being replaced by fool’s gold, iron pyrite. There are no cells left here. We don’t even know for sure that these are eukaryotic cells; they probably are, indicated by the presence of a sterane chemical signature in the rocks that is characteristic of eukaryotes, but there isn’t even enough fine detail to tell whether there was a nucleus in these cells. It just breaks my heart.

It’s a beautiful tease. We can see that life was exploring the edges of multicellularity over 2 billion years ago, but…the molecular sinews that stitched them together are all gone. The signals and receptors that enabled communication between them are all gone. The genes that drove their growth are all gone. There is nothing left but a blurry crystal-ruptured outline of what once was.

I have to shake an angry fist at you, fossils. I won’t go all Mel Gibson in incoherent rage at you because I like you too much, but still…you taunt me. I want your cells. Nothing less will do.


El Albani A, Bengtson S, Canfield DE, Bekker A, Macchiarelli R, Mazurier A, Hammarlund EU, Boulvais P, Dupuy JJ, Fontaine C, Fürsich FT, Gauthier-Lafaye F, Janvier P, Javaux E, Ossa FO, Pierson-Wickmann AC, Riboulleau A, Sardini P, Vachard D, Whitehouse M, Meunier A. (2010) Large colonial organisms with coordinated growth in oxygenated environments 2.1 Gyr ago. Nature 466(7302):100-4.


Chris Nedin, who should know, does not think these fossils represent multicellular organisms at all — they are fossilized, folded microbial mats. Which is fine by me — 2 billion year old microbial mats are also exceedingly cool, and I still want their cells.

You do know that if you want to know more about anything pre-Cambrian, you should be reading Ediacaran, right?

Chickens, eggs, this is no way to report on science

Bleh. MSNBC is running a terrible article that claims they have “proof” that chickens came before eggs. It’s just an awful mess, and one of the scientists is at least partly responsible.

The scientists found that a protein found only in a chicken’s ovaries is necessary for the formation of the egg, according to the paper Wednesday. The egg can therefore only exist if it has been created inside a chicken.

“It had long been suspected that the egg came first but now we have the scientific proof that shows that in fact the chicken came first,” said Dr. Colin Freeman, from Sheffield University’s Department of Engineering Materials, according to the Mail.

No. What they found was a specific molecule called ovocleidin which is a member of a family of C-type lectin-like proteins. These things are all over the place; they’re cell adhesion molecules, some are involved in cell signaling, some function in modulating the immune system and blood clotting pathways. They’re even found in snake venoms. They’re found in everything from C. elegans to mammals. Their key property is that they bind calcium.

In birds, these proteins have been coopted to regulate egg shell formation. They bind calcium and can seed the crystallization of calcium carbonate, and also control the rate of crystal formation. Chickens have ovocleidin, but geese have an ortholog, ansocalcin, and ostriches have struthiocleidin. There seems to be a lot of lability in what particular calcium-binding protein is used in shell formation, and it’s probably the case that most of the sequence is free to mutate without affecting the nucleating function.

You simply can’t make the conclusion the reporter was making here. The species ancestral to Gallus gallus laid eggs, the last common ancestor of all birds laid eggs, the reptiles that preceded the birds laid eggs…the appearance of egg laying was not coincident with the evolution of ovocleidin. The first chicken that acquired the protein we call ovocleidin now by mutation of a prior protein also hatched from an egg.

What were the people involved in this story thinking?

How not to evaluate a big science program

Nicholas Wade of the NY Times has written one of those stories that make biologists cringe — it just gets so much wrong. It’s a look back at the human genome project, and I was turned off at the first paragraph. The HGP was badly marketed from the very beginning in the sense that there was a misrepresentation of the scientific goals; it was well-marketed if your goal was wringing money out of congress. Unfortunately, now we’ve got to deal with science writers complaining that nobody has generated any miracle cures from all that work. Pay attention to what Harold Varmus said:

“Genomics is a way to do science, not medicine,” said Harold Varmus, president of the Memorial Sloan-Kettering Cancer Center in New York, who in July will become the director of the National Cancer Institute.

The genome is a basic research tool, not a recipe book for curing diseases. I can’t entirely blame Wade for complaining about this, though, since some prominent people like Francis Collins were selling the HGP as the first step in generating a panacea.

But Wade ought to be embarrassed at the rampant linear ladder thinking in his article. Both Jonathan Eisen and Larry Moran take him to task for that — he makes this error-filled statement:

The barely visible roundworm needs 20,000 genes that make proteins, the working parts of cells, whereas humans, apparently so much higher on the evolutionary scale, seem to have only 21,000 protein-coding genes.

Humans aren’t high on the evolutionary scale…there is no evolutionary scale. We aren’t the pinnacle of anything. It’s also weird to see people still expressing astonishment that we “only” have about 20,000 genes. Way, way back in the dim and distant past, when I was a lowly undergraduate in 1977 (AD, I think), my genetics professor, Larry Sandler, lectured to us about how Drosophila was thought to have about 10-15,000 genes and humans might have about twice that…but that when you looked at the C-value paradox (that the quantity of DNA in organisms doesn’t correlate at all well with our perceptions of complexity), it really didn’t mean much, especially since we didn’t (and still don’t) know what most of those genes do. In the early days of the HGP there was a mad flurry of speculation, mostly from people with economic interests in more genes, that there were 100-200,000 genes, but everyone who knew anything about genetics gave those a squinty cynical look.

Apparently, there’s going to be a second article in this series from Wade: “Next: Drug companies stick with genomics but struggle with information overload.” Please. If you want to do a retrospective on the impact of the human genome project, don’t go talking to the drug companies.

Autism and the search for simple, direct answers

I’ve gotten some email asking for a simplified executive summary of this paper, so here it is.

A large study of almost a thousand autistic individuals for genetic variations that make them different from control individuals has found that Autism Spectrum Disorder has many different genetic causes: there isn’t one single gene responsible for ASD, but a constellation of hundreds, each with the potential to affect the development of the brain and cause the symptoms of autism. They don’t know exactly how each of these genes contributes to the disorder, but they have found that many of them are involved in growth and cell communication and the formation of synapses in the brain.

The bottom line is that there are many different ways to cause the symptoms of autism, and it’s a mistake to try to pin it all on single, simple causes. Any hope for amelioration lies in understanding the general functional processes that are disrupted by mutations in various pathways.

i-e88a953e59c2ce6c5e2ac4568c7f0c36-rb.png

Coming up with simple, one-size-fits-all answers to serious problems is so tempting and so satisfying. Look at autism, for instance: a mysterious disease with a wide range of expression, so wide that it is more properly called Autism Spectrum Disorder (ASD), and the popular press and various celebrities all want it to be pegged to a simple cause: it’s vaccines, or it’s mercury, or it’s the dose of the vaccines, and all we have to do to fix it is not vaccinate, or reduce the number of vaccinations, or use chelation therapy to extract poisons, and presto, a cure! This is magical thinking, pure and simple, and it doesn’t work.

ASD isn’t simple, it’s not one disease, it doesn’t have one cause, and vaccines are definitely not the cause: if there’s one thing the research has done, it’s to thoroughly rule out the idea that giving kids shots at an early age causes autism. What we’re actually discovering more and more is that ASD can be traced to genetic variation.

Again, though, the causes aren’t simple. There is no single mutation to which ASD can be pinned.

For example, one hot spot for an association of genes with autism is the long arm of chromosome 22; cases of developmental delays and autistic behavior have been associated with partial deletions in chromosome 22, and the problems have even been narrowed down to one specific gene, SHANK3, which is expressed in neurons and localized to synapses. We know that if you’ve got a broken copy of this particular gene, you’re likely to have ASD.

How many ASD individuals have this specific genetic change? 0.75%. It is a cause in less than 1% of all affected individuals, but it cannot be the sole cause of ASD in all cases. We have to get out of this mindset that tries to find single causes for complex phenomena; ASD is a case where we have a complex range of disorders with multiple, complex causes.

So how do we get a handle on ASD? This is where the work gets interesting: just because something is multi-causal does not mean that science can’t get a grip on it and that we can’t learn anything interesting about it. We’ve got lots of new tools for analyzing broad properties of genomes now, and one promising line of attack are methods for measuring and identifying copy number variants in individuals and populations.

Copy number variants (CNVs) are surprisingly common. If you’ve had any biology instruction at all, you’re probably familiar with the Mendelian concept that we have two copies of each chromosome, and two copies of each gene. As it turns out, that is an oversimplification: sometimes, a piece of a chromosome is accidentally duplicated, and then you’ll carry two copies of the associated gene on one chromosome, and one copy on another chromosome, for a total of 3 copies. And in some cases, these duplications have occurred often enough that you’ll have many more than 3; the median number of copies of the amylase gene (an enzyme that breaks down starch) in European American populations is 7, with a range of 2 to 15 in different individuals. Get used to it, this kind of variation in copy number seems to happen fairly often.

Now in the case of amylase, the effect of this variation is mild — individuals with more copies of the gene produce more of the enzyme and break down starchy foods faster. It does have evolutionary effects, since cultures with diets rich in starch contain individuals who have, on average, more copies of the gene than individuals where starches are less common in the diet. But what if these chance variations in copy number affect genes involved in the function of the brain? We might see more profound effects on behavior or cognitive ability. The defect in SHANK3 mutations is an example of a reduction in copy number of that gene; what if we could screen populations of ASD individuals not for a specific gene variant, but for the more general occurrence of frequent variations in copy number of any genes…and then we could ask which genes are often affected?

It’s being done. A new paper in Nature describes a screen of control and ASD individuals to identify rare copy number variants associated with autism. It worked! In fact, it worked maybe a little too well, since we now have an embarrassment of riches, a great many genes that may be related to ASD.

The autism spectrum disorders (ASDs) are a group of conditions characterized by impairments in reciprocal social interaction and communication, and the presence of restricted and repetitive behaviours. Individuals with an ASD vary greatly in cognitive development, which can range from above average to intellectual disability. Although ASDs are known to be highly heritable (~90%), the underlying genetic determinants are still largely unknown. Here we analysed the genome-wide characteristics of rare (<1% frequency) copy number variation in ASD using dense genotyping arrays. When comparing 996 ASD individuals of European ancestry to 1,287 matched controls, cases were found to carry a higher global burden of rare, genic copy number variants (CNVs) (1.19 fold, P = 0.012), especially so for loci previously implicated in either ASD and/or intellectual disability (1.69 fold, P = 3.4 × 10-4). Among the CNVs there were numerous de novo and inherited events, sometimes in combination in a given family, implicating many novel ASD genes such as SHANK2, SYNGAP1, DLGAP2 and the X-linked DDX53-PTCHD1 locus. We also discovered an enrichment of CNVs disrupting functional gene sets involved in cellular proliferation, projection and motility, and GTPase/Ras signalling. Our results reveal many new genetic and functional targets in ASD that may lead to final connected pathways.

They analyzed both affected individuals and their parents, and found both familial transmission — that is, the child with ASD had received a copy number variant from a parent who was a carrier — and de novo events — that is, the child had a spontaneous, new mutation that was not present in either parent. There is no one single gene that can be tagged as the cause of autism: they identified 226 de novo and 219 inherited copy number variants in affected individuals. No one individual carries all of these variants, of course — the results tell us that there are many different paths to ASD.

Oh, no, you may be tempted to wail, autism is hundreds of diseases, with even more possible combinations of variants, and every individual is unique — this is no way to get a handle on what’s actually happening to autistic kids! Don’t despair, though, this is just the start. Although there are many genes involved, we can try to ask what all of them have in common functionally. There may be common consequences from all of these different genes, so maybe we can identify the common errors in the process of building a brain that lead to ASD.

Here’s a first stab at puzzling out what these genes do. The genes that have been identified as being deficient in ASD individuals are mapped out by known functions, and what jumps out at you is that the hundreds of specific genes fall into a smaller number of functional categories. Many of them cluster in a few functional roles: cell proliferation (genes that affect the number of cells in a tissues) and cell projection (particularly important in neurons, where cells will extend long processes that project into target regions), and a specific class of cell signaling molecules, RAS-GTPases, which are involved in how cells communicate with one another and are particularly important in synapses, or the linkages between neurons.

i-8d23aed462751aa3822b506f48725d65-asd_map-thumb-425x181-50842.jpeg
(Click for larger image)

Enrichment results were mapped as a network of gene sets (nodes) related by mutual overlap (edges), where the colour (red, blue or yellow) indicates the class of gene set. Node size is proportional to the total number of genes in each set and edge thickness represents the number of overlapping genes between sets. a, Gene sets enriched for deletions are shown (red) with enrichment significance (FDR q-value) represented as a node colour gradient. Groups of functionally related gene sets are circled and labelled (groups, filled green circles; subgroups, dashed line). b, An expanded enrichment map shows the relationship between gene sets enriched in deletions (a) and sets of known ASD/intellectual disability genes. Node colour hue represents the class of gene set (that is, enriched in deletions, red; known disease genes (ASD and/or intellectual disability (ID) genes), blue; enriched only in disease genes, yellow). Edge colour represents the overlap between gene sets enriched in deletions (green), from disease genes to enriched sets (blue), and between sets enriched in deletions and in disease genes or between disease gene-sets only (orange). The major functional groups are highlighted by filled circles (enriched in deletions, green; enriched in ASD/intellectual disability, blue).

The second map above ties the various copy number variants to previously known disease genes involved in ASD, and what catches my eye is the dense cloud of variants associated with central nervous system development. That tells me right there that it is inappropriate to treat ASD as something that is switched on or off by simple causal factors: ASD is the product of long-developing, subtle changes in the growth of the nervous system in embryos and infants.

So the conclusion, as expected, is that ASD is a multi-factorial disorder with a strong genetic component — but definitely not single-locus inheritance, as many different genes are involved.

Our findings provide strong support for the involvement of multiple rare genic CNVs, both genome-wide and at specific loci, in ASD. These findings, similar to those recently described in schizophrenia, suggest that at least some of these ASD CNVs (and the genes that they affect) are under purifying selection. Genes previously implicated in ASD by rare variant findings have pointed to functional themes in ASD pathophysiology. Molecules such as NRXN1, NLGN3/4X and SHANK3, localized presynaptically or at the post-synaptic density (PSD), highlight maturation and function of glutamatergic synapses. Our data reveal that SHANK2, SYNGAP1 and DLGAP2 are new ASD loci that also encode proteins in the PSD. We also found intellectual disability genes to be important in ASD. Furthermore, our functional enrichment map identifies new groups such as GTPase/Ras, effectively expanding both the number and connectivity of modules that may be involved in ASD. The next step will be to relate defects or patterns of alterations in these groups to ASD endophenotypes. The combined identification of higher-penetrance rare variants and new biological pathways, including those identified in this study, may broaden the targets amenable to genetic testing and therapeutic intervention.

There aren’t any simple answers. There are some hints of hope for future treatment, though, in the recognition that there are a few functional modules that are being commonly impaired by these many different genes — it at least focuses the direction of future research in to some narrower domains.

One fact is so obvious that it’s unfortunate I have to mention it: no external agent, such as a vaccine, can generate a consistent pattern of duplication and deletions in an affected individual’s cells. These data say it’s an error to chase down transient environmental agents given relatively late in life to people.


Pinto D et al. (2010) Functional impact of global rare copy number variation in autism spectrum disorders Nature doi:10.1038/nature09146.