Yikes. These data jerked me right back to the first lab of my genetics course, where we learn basic principles of probability with exercises in coin flipping and dice rolling.
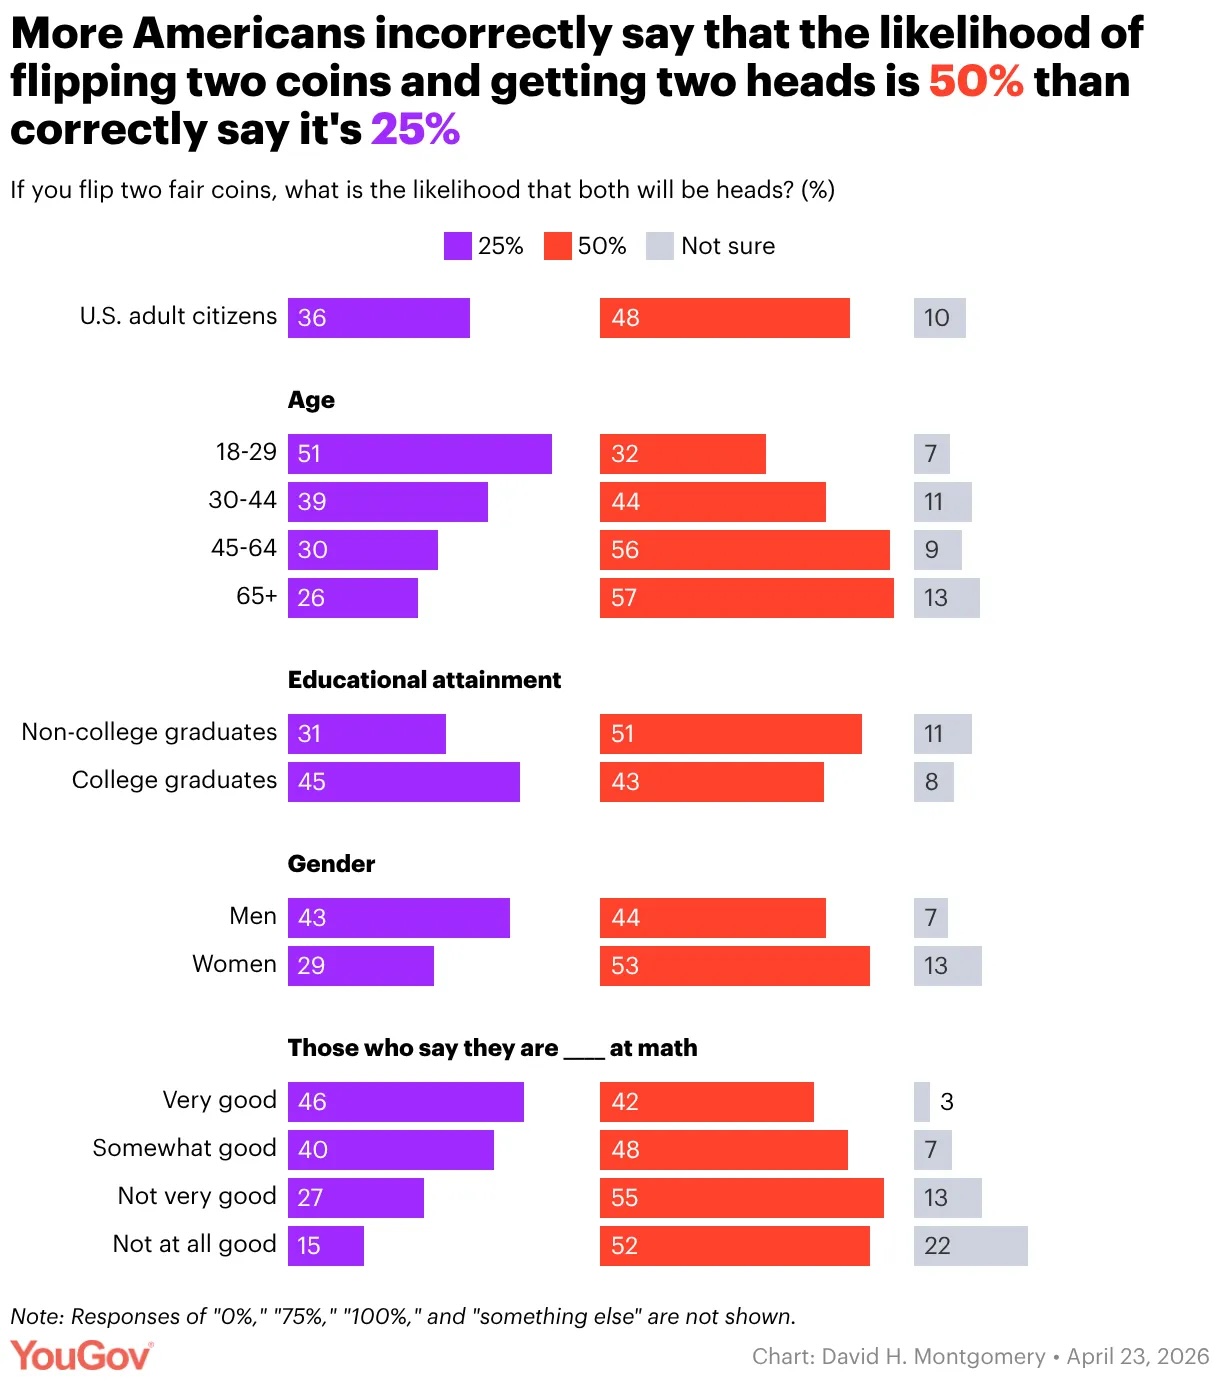
More Americans incorrectly say that the likelihood of flipping two coins and getting two heads is 50% than correctly say it’s 25%
I never even thought to ask them if they had a different, incorrect assumption about probability, we just did ‘experiments’ to see what the results were (and also learned some simple statistics and calculations). I am confident that if my students were asked this question they’d say 25% with no hesitation…although they might also go on a bit about chance variation and bell curve distributions.
Although the ignorance on display in that chart might explain a different phenomenon: US gambling addiction is ‘out of control’ as betting markets boom, policy expert warns. Yeah. I swear that almost half the ads I see online are about betting.
Prediction market platforms – where users can bet on everything fromaward winners and war developments, to what someone might wear, or what an artist will sing on stage – have meanwhile surged in popularity in the last few years, with more than $1bn traded on Kalshi during Super Bowl Sunday alone.
Prediction market platforms contend that they are not gambling platforms, but rather financial trading platforms. Critics argue they are gambling under another name.
It’s gambling.
It’s preying on stupid people. That chart says that that’s about 48% of the US adult population, so I can see how it’s lucrative.
Wait. I just noticed the footnote on the chart: “Responses of ‘0%’, ‘75%’, ‘100%’, and ‘something else’ are not shown”. I assume that’s the difference between the frequency of responses shown and 100%, but I want to know how deep the ignorance runs.

Wow — seems like working out how that conclusion is wrong wouldn’t take too much analytic depth.
And the surging prominence of the mant variations of e-casinos would be a subject for our 🥸 so-effective politicians to address, but, well ….
I suspect that the problem isn’t so much misunderstanding statistics, as that a lot of the people who got it wrong didn’t take the time to understand what the actual question was.
I see this all the time. People who are capable of doing the mechanical part of solving a mathematics problem out of a textbook, go all to pieces when you ask them to take a problem stated in words and use it to set up the problem in mathematical terms in the first place.
As Bayesian priors go, 50% isn’t the worst-case answer. It shouldn’t take many more events to nudge it over to 25%.
I inherited a coin collection from my aunt that was started by my grandfather. While going through some boxes of miscellaneous unsorted coins I came across a two-headed 1964 Kennedy half dollar. It’s obviously been manufactured from 2 coins because whoever made it neglected to file off the sharp burr where he inserted the cut-down coin into the hollowed out one. I was able to fool my grandkids for a minute or so, until the oldest one asked to look at it.
I wonder how many claimed their answer was based on their own independent research, instead of taking the word of Big Probability.
A course in probability and statistics should be required before graduation from high school.
@6 Reginald, it appears the people just out of high school do mostly get the answer right. But then their math abilities start deteriorating.
If you flip a Hamilton Coin Collection Trump coin, it will have a 100% probability of coming up heads.
(Hamilton doesn’t seem to have any other coins, but ye gods, so much kitsch… the elephant figurines may be the worst, but I couldn’t handle browsing beyond those.)
Interestingly, the “Those who say they are ___ at math” seems to show a divergence from Dunning-Kruger theory.
Do the red 50% bars have anything to do with Red State gamblers?
Of course it is gambling. Money is placed toward an outcome. If the outcome is achieved, you win money. If the outcome is not achieved, you lose your money. There is no logical way to define this as “trading” other than the fact that money is trading hands.
There are people in America who think their odds of winning the lottery are 50%.
“Either I win or I lose, so I figure it’s 50-50.”
Betting is more lucrative if you work at the pentagon.
Just checking… OK. https://yougov.com/en-us/daily-results/20260423-c0a34-2
beholder @3:
That would compound the ignorance; the probabilities are already known!
Bayesian priors are used when the parameters are uncertain, and there is no need for iterative event to determine the probabilities.
(Or: the question is deductive, not inductive)
Why is this game only legal across Australia one day a year?
@9 Richard Smith
It’s entirely consistent with it. The trend line in skill using perceived skill as a control variable is positive, it just has a slope of less than 1. There’s a slight oddity around the not at all good and not very good answers for 50% specifically, but it doesn’t exist around the correct answer and even if it did data are noisy.
Knabb@16–
As you say, the data here are consistent with the original D-K conclusions, but not with the common misrepresentation of it. Having said that, there is significant criticism of the D-K concept, with some studies suggesting it is a “Negligible influence on a limited segment of the population”. Others suggest it is nothing but statistical artefact — although I think this is overly dismissive and agree with Dunning’s defence of the concept and its research base.
Either way, there is no doubt that it has become a new fallacy of it’s own. As Dunning himself says, people use it for cheap out-group denigration without realising “[t]he effect is about us, not them.” (Note this quote is from an interesting article questioning the existence of the D-K effect that has some very deep flaws in its probabilistic reasoning.)
My first guess would be it’s a reading problem, not a probability problem. People might not read carefully and assume the question being asked is slightly trickier: “what is the likelihood that two coin flips have the same outcome?”
Of course, not being able to read is a worse problem than not being able to do probability…
I agree for many the failure likes in misreading the question as “the likelihood of two coin flips having the same outcome,” and I would attribute that mainly to not speeding through the survey and not paying attention. I think there are real problems with using surveys as a mechanism for measuring the prevalence of this type of knowledge. I’d like to know how many questions were in the survey and where did this one fall? After a few questions people get bored and just start clicking through faster. And if this were a phone survey, the problem would be even worse, as one cannot re-listen to the wording of the question.
Dave, https://yougov.com/about/methodology
TL;DR: it’s a set of people who sign up, provide info, and can be sampled algorithmically.
So for each one a subset get a few questions; in this case the other one was presumably math competence.
Quite robust protocol, seems to me.
Notice the 2 in the URL I adduced @14, which indicates it’s the second question, after the date and the survey ID.
If you ask your president, the answer is unfortunately not a coin flip…