We have this lovely old slippery elm in our backyard — it’s huge and thickly branched and towers over our house. This evening we noticed that sometime during the day, we had a visitor.
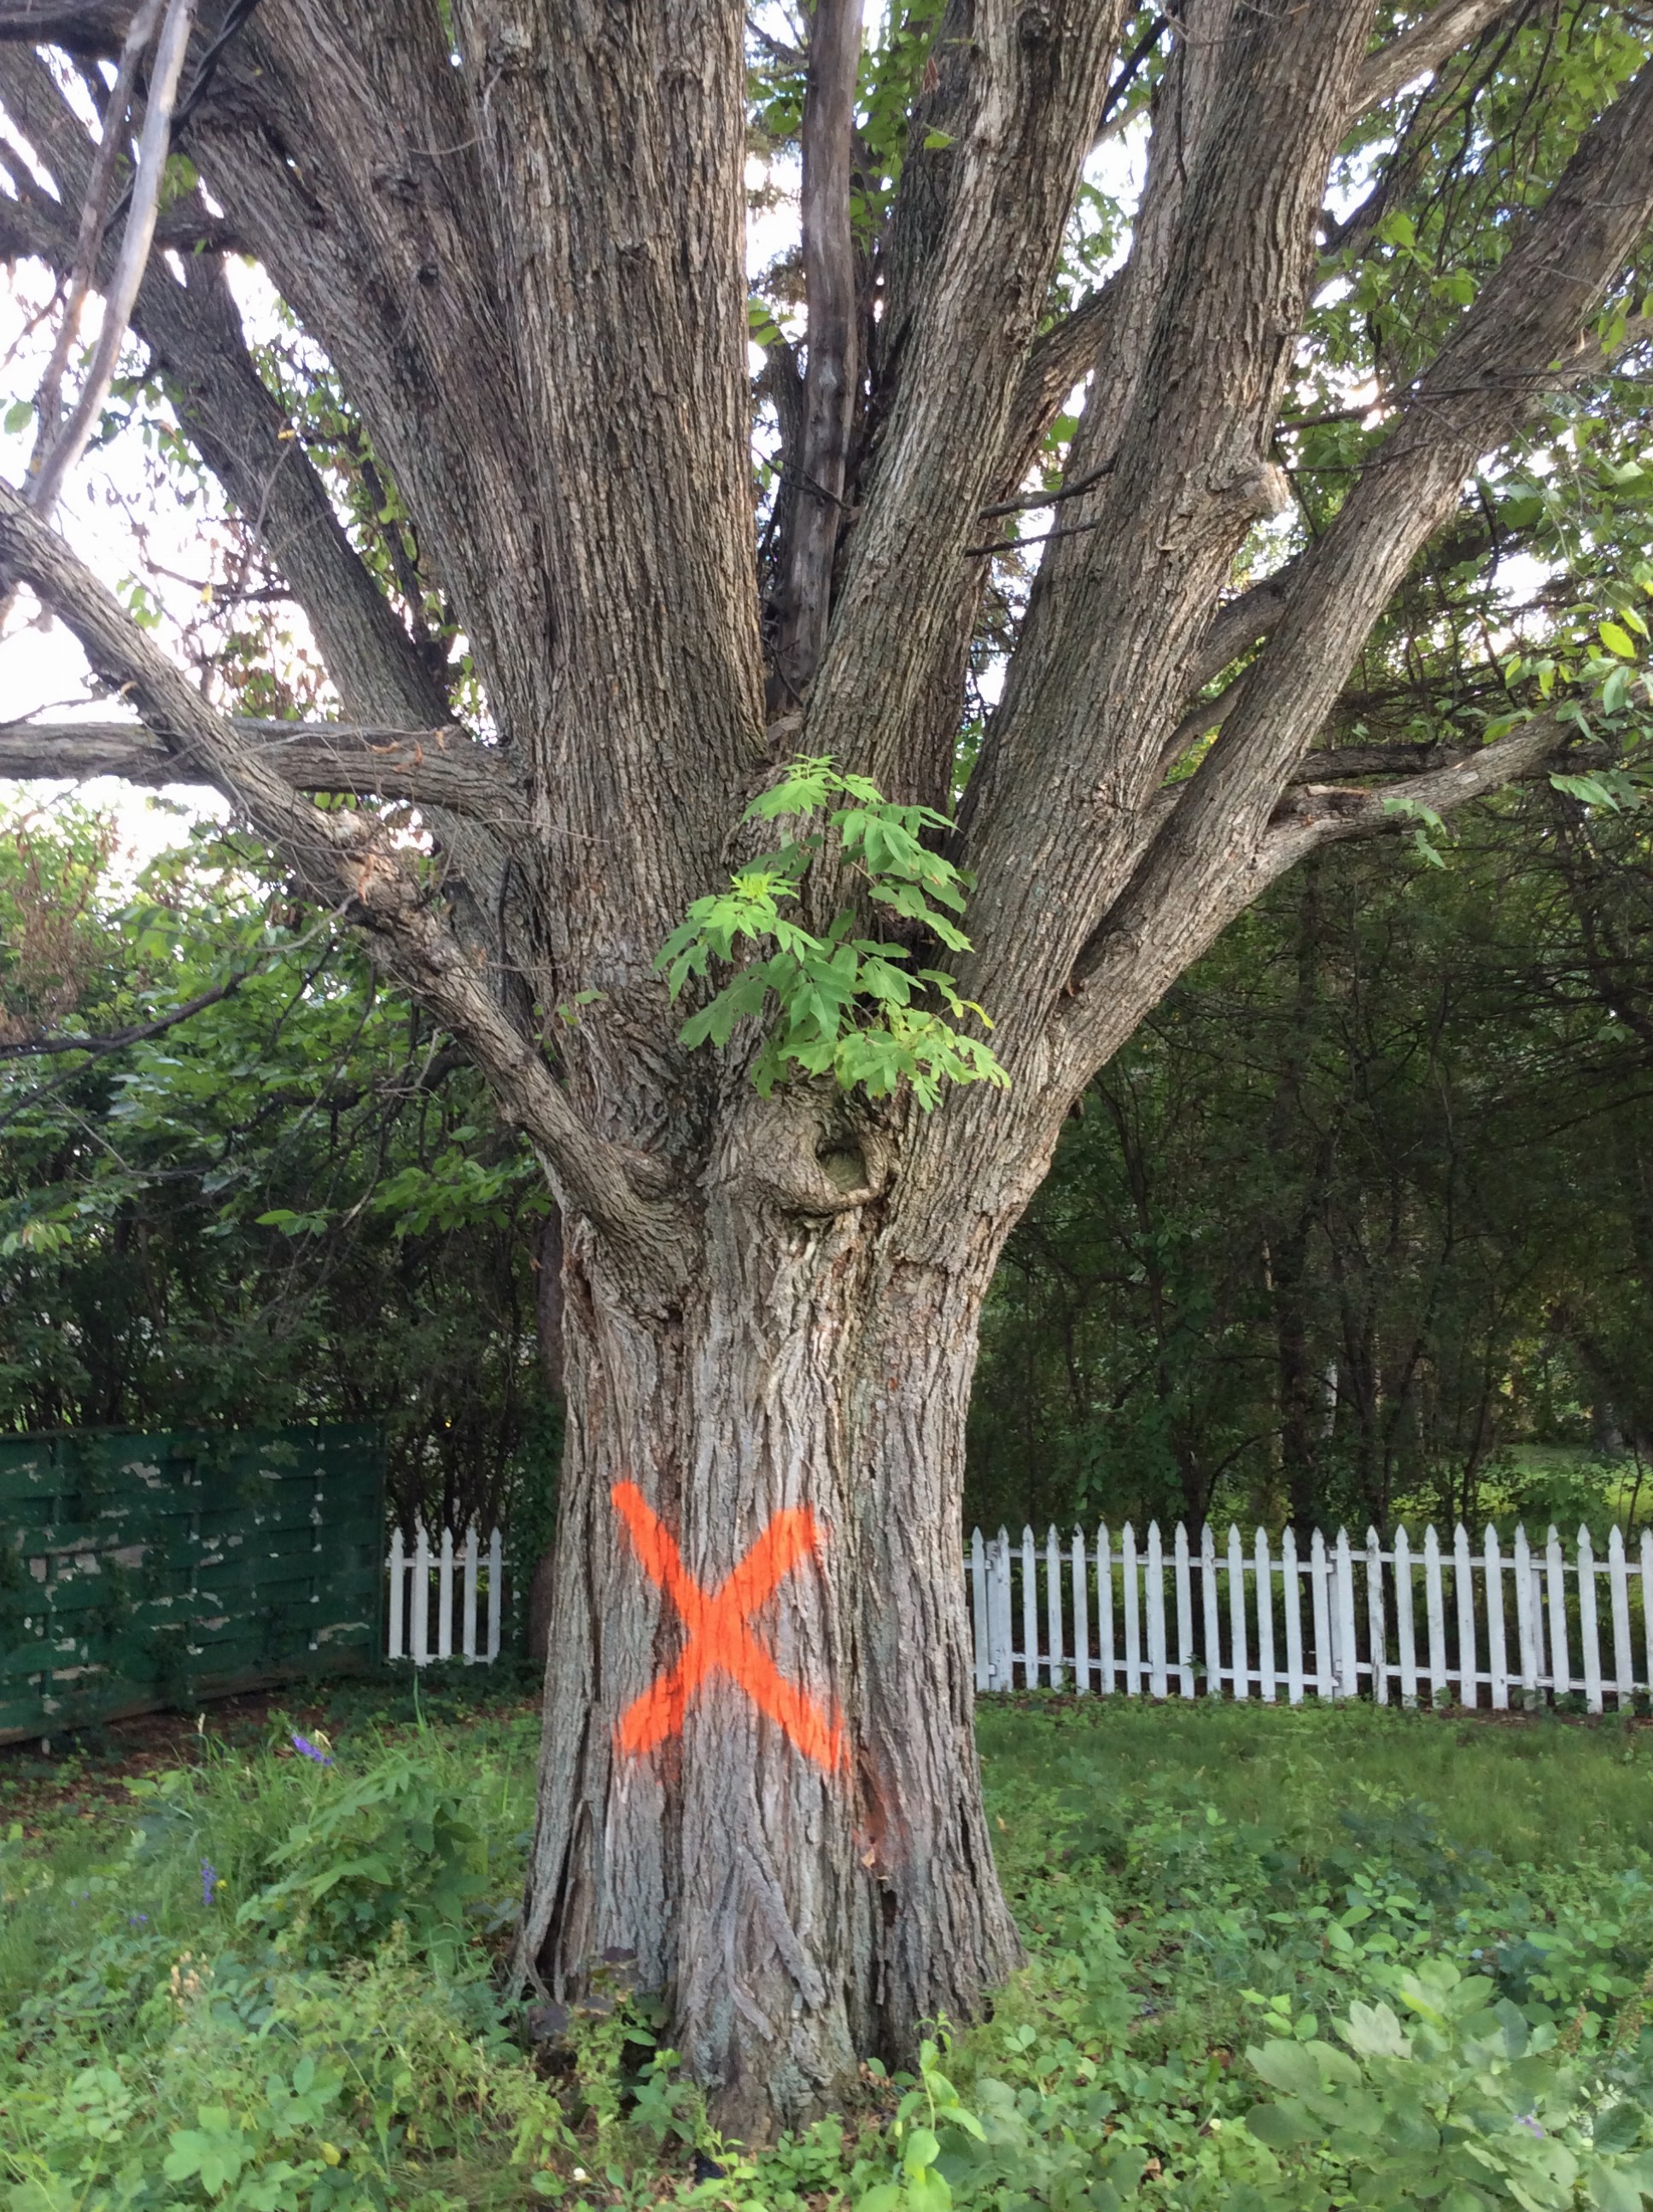
That is not a good sign. We’ll have to call the tree doctor tomorrow and get a diagnosis.