The asymmetry of US politics
Vox recently had a good video talking about “asymmetrical polarization”. Basically, this means that the two political parties in the US are moving further apart, and this is mostly driven by the Republican party, rather than the Democrats.
There are many aspects to this argument. Republicans have been more obstructionist than democrats, less likely to negotiate or compromise, and more likely to use filibusters. Their agenda has become more extreme over time. Democrats have also moved further left (despite complaints hereabouts that Democrats are too moderate), but in a way that trails the motion of the Republican party.
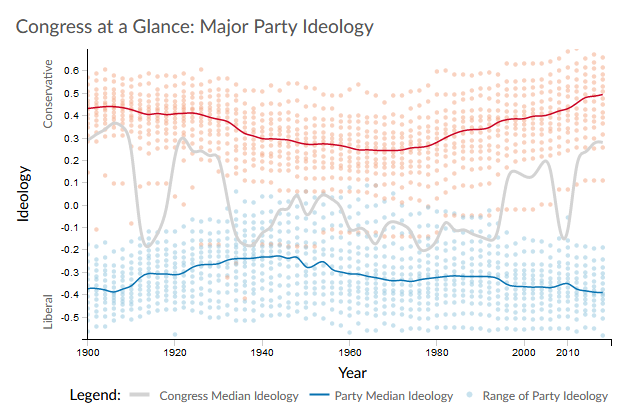
These many arguments stand on their own. But I want to address the very first argument that Vox presents, which comes from the following graph:

Image credit: Voteview. I abridged the graph to only show history after 1900. Red dots represent Republicans, blue dots represent Democrats, and the solid lines represent party medians.
As you can see, the two parties have slowly moved further apart since the 50s. But you can learn even more by studying the y axis of the graph. Today, the Republican congress is around +0.5, while the Democrat congress is around -0.4, which seems to indicate that the Republicans are more extreme than the Democrats. This is in contrast to, say, 1975, when the Republicans were around 0.25, and Democrats were around -0.35, indicating a more extreme Democratic party.
But my first reaction to this graph is, where the fuck do those numbers come from?
Understanding DW-NOMINATE
I ask, already knowing the answer. These numbers are DW-NOMINATE scores. NOMINATE is a wildly successful tool developed by political scientists in the 80s to quantitatively and objectively summarize the voting behavior of congress. DW-NOMINATE is the most commonly used version of NOMINATE, because it accounts for the changing views of of congress members over time.
I read a primer on NOMINATE so you don’t have to. NOMINATE uses a model, where each member of congress is represented by a fixed position on a two-dimensional political spectrum. Each time congress holds a roll call (i.e. a vote), a “yay” is represented by one point on the spectrum, and a “nay” vote is represented by another point on the spectrum. The member of congress is predicted to vote “yay” or “nay” depending on which position is closer to themselves. However, the model also has a probability that a member of congress will vote for the position further from themselves, and that depends on the relative distances of “yay” and “nay”, as well as the congress member’s error function. (In DW-NOMINATE, congress members aren’t in a fixed position, but are allowed to drift at a constant rate over time.)
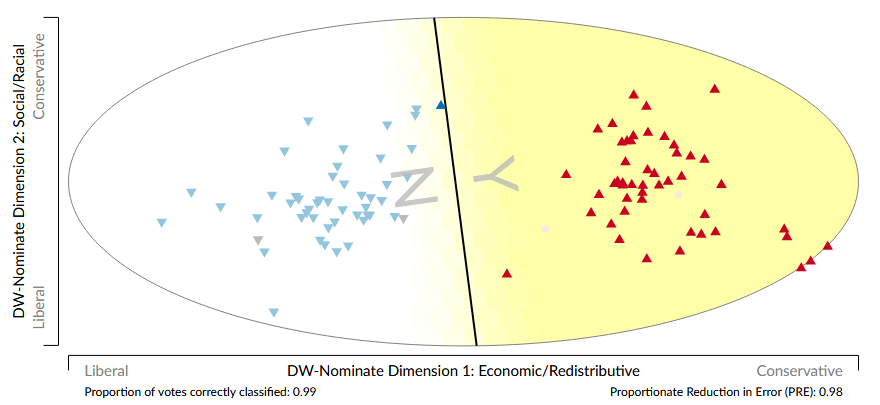
To show this model in action, here is a graphical representation of a recent roll call in the senate. The bold dividing line represents the perpendicular bisector between the “yay” and “nay” positions.

Image credit: Voteview. Blue symbols indicate Democrats, red symbols indicate Republicans, gray triangles indicate independents, and beige circles indicate absences. Downwards-pointing arrows indicate nays, and upwards-pointing arrows indicate yays. The vote in question is the confirmation of Kavanaugh as Supreme Court justice.
The hard part is determining where on the map each member of congress is, and where “yay” and “nay” are located for each roll call. Basically, the positions are selected in such a way that it maximizes the likelihood that congress members would vote the way that they ended up voting. This is called maximum likelihood estimation, or MLE. MLE is computationally very difficult, but the exact method doesn’t matter for our purposes.
This whole calculation is done in an objective manner, without even looking at the substance of each of the votes. But of course, we have to eventually look at the substance of the votes, in order to understand what these two dimensions are. The first dimension appears to be the left-right spectrum. The second dimension appears to be primarily about race, and sometimes other social issues. The second dimension has become less important in the past few decades, I think because the issue of race is getting folded into the left-right spectrum. I believe the graph at the top only shows the position of congress along the first dimension.
There’s one amazing and important result to come out of this analysis: there are only two important dimensions! Political scientists tried different numbers of dimensions, and assessed the accuracy of the model in each case. With one dimension, the accuracy was 83%. With two dimensions, the accuracy was 85%. Adding more dimensions didn’t help. So it’s true that about 15% of votes can’t be explained by the model (except as random errors), but nor can they be explained with further dimensions.
Apparently, the one historical exception is just before the civil war, when the model is improved by having more dimensions. So you might say that having more dimensions is not necessarily desirable.
I’m splitting this discussion into two posts. In the next one, I’ll talk about what asymmetrical polarization means in the context of DW-NOMINATE.

According to that chart, Republicans in Congress reached their maximum liberality about the time Goldwater ran for president.
The Cold War. Segregation. The war on Vietnam.
* raises one eyebrow *
@Pierce R. Butler,
Support for the Cold War and segregation were more bipartisan at the time than you might think. Remember that DW-NOMINATE doesn’t use any information about the specific things that people voted on, just the differences in voting behaviors among different members of congress.
Siggy @ # 2 – I was just coming of political awareness at the time, and remember LBJ’s rain of bombs on Vietnam all too bitterly.
(Only later did I find out official Washington privately realized the US could never “win” that war, but that Johnson murdered millions because he knew any other course would leave an opening for the just-as-aware Republicans to call the Democrats “weak” – and that the not-so-aware public would punish the D’s and reward the R’s accordingly.)
… DW-NOMINATE doesn’t use any information about the specific things that people voted on, just the differences in voting behaviors among different members of congress.
An abstraction for which they should probably use labels other than “liberal” and “conservative”.
Nit: The synonym of “aye” is its anagram spelled “yea”, not “yay”.
You’re right, “yay” is an eggcorn on my part.