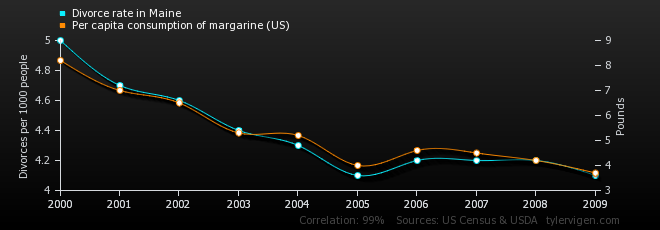
One of the commonly heard aphorisms of reasoning is that correlations do not imply causation. It is good to be periodically reminded that correlations themselves can sometimes be so high as to suggest causality and this site offers a few amusing spurious correlations, reminding us to not be seduced into taking them seriously.
Here is one example where the correlation coefficient is 0.992558, an almost perfect correlation, between the divorce rate in Maine and the per capita consumption of margarine in the US over time.
But like most absolutist assertions, the statement that correlation does not imply causation needs to be qualified. Sometimes correlation can strongly suggest causation if there is a plausible causal mechanism at play that goes only in one direction and that direction far more likely than the other possible causal directions.
For example, the fact that the rise in average global temperatures correlates with the rise in atmospheric greenhouse gases is strongly suggestive that the former is caused by the latter because we can independently explain why greenhouse gases are increasing and there is a mechanism that shows how they inhibit the loss of heat from the Earth.
On the other hand the reverse direction of causation, that a rise in average temperatures causes an increase in greenhouse gases, is far less plausible because we would then still need to explain the cause of the temperature rise and then suggest a mechanism that explains why it leads to a rise in greenhouse gases.
A third possibility is that the two effects do not cause each other but are both caused by some third factor. But again that needs to be fleshed out more before it can be taken seriously.


That’s right, you basically ran through the four possibilities of correlation: Causation, Reverse Causation, Common Causation, and Coincidence.
And when people make the claim “correlation does not equal causation” in arguments, they are implying that it is a Coincidence. Which is why the follow up question should be “are you saying that this is just a coincidence?” because they need to make such a claim explicit. Often, they won’t want to make that claim explicit (depending on the claim) because they will look ridiculous.
Actually, a rise in global temperatures will result in an increase in greenhouse gasses such as methane. This is because the increase in global temperatures will result in the release of methane from the tundra in places like northern Canada and Siberia.
When people divorce they spend a lot of money on lawyers and procedures, and then they need to spend money on new living arrangements, so they end up having less money, which causes them to switch from butter to margarine. Obvious. :p
@anat,
Not bad! Have you thought about applying for a job with climate change denialist groups?
With sufficient increase there would also be other releases of methane from thawed methane-ices in lower parts of the oceans. Further one might also expect increased levels of chlorinated fluorocarbons and carbon dioxide due to increased human usage of contraband regrigerant gases and the simple increase of energy usage to power these activities
I’m with anat
Brilliantly logical, persuasive and just about possible
(damn you anat I wanted to say it first) 🙂
The correct way to think about it is that correlation is required for causation and is not an argument against. Too often “correlation is not causation” it used to dismiss a correlation or argue against a correlation.
A fourth possibility is that the two may play different roles in different warming periods. In complex systems, there is no necessary exclusive ‘or’. Taking two variables (say, temperature and CO2), and insisting that a rise in one must always precede a rise in the other, is naive at best. In the case of deniers, it’s just the usual dishonesty.
Further to my #7. Two scenarios;
1) CO2 is dumped into the atmosphere. Warming follows, because physics.
2) Warming occurs due to orbital forcing. Subsequently, warmed oceans emit appreciable levels CO2 with a few centuries lag. CO2 and other released gases further increase warming.
I think number (2) is the current best explanation for Antarctic ice core data for 200,000+ years ago.
I meant my #8.
Causation implies correlation.
Not so obvious.
It’s the fake butter that greases the slippery slope to faking other essentials in marriage. That never lasts long.
I think there is another issue that is often forgotten: the correlation coefficient betwen two straight lines is either +1 or -1 (or undefined if one of the straight lines is constant). So anything that can be somewhat approximated by a straight lines will have high correlation coefficients, above 0.9.
Corrletion is only meaningful when there are several variations, ups and downs. Any simple monotonic change will be highly correlated to any other monotonic change.
This leads us to a second issue, related to how the data is displayed. The graph above has a smooth line conecting the dots, probably a spline. These points are the result of complex processes and probably has a lot of statistical noise. The use of a spline infers a behavior that probably does not exist. No lines connecting the dots is probably more “honest” but to better see the tendency, straight segments are a better alternative.
Someone once said that statistics is the art of torturing numbers until they confess what you want.
[meta]
pjabardo @13, a good point.
(Semantic nitpick: you wrote “The use of a spline infers” when you meant “The use of a spline implies”)