A Hat Tip to Mandelbrot
Grab a sheet of paper. Near the top, write a number, any one you want. In your head or with a calculator, multiply that number by itself, then add the original number you had before multiplying, and write the result below that first number. Take the number at the bottom of the column, multiply it by itself, add the number at the top of the column, and write the result at the bottom of the column. Continue that last step until you’re bored, then start a new column with a new first number and repeat it all again. If you won’t or can’t play along, I’ll share what’s on my paper:
|
-1.750000 x -1.750000 – 1.750000 = 1.312500 x 1.312500 – 1.750000 = -0.027343 x -0.027343 – 1.750000 = -1.749252 x -1.749252 – 1.750000 = 1.309882 x 1.309882 – 1.750000 = -0.034209 x -0.034209 – 1.750000 = -1.748829 x -1.748829 – 1.750000 = 1.308402 x 1.308402 – 1.750000 = -0.038084 x -0.038084 – 1.750000 = -1.748549 x -1.748549 – 1.750000 = . . . |
-1.750000 1.312500 -0.027343 -1.749252 1.309882 -0.034209 -1.748829 1.308402 -0.038084 -1.748549 1.307423 . . . |
-2.000000 2.000000 2.000000 . . . |
-2.250000 2.812500 5.660156 29.78736 885.0371 . . . |
0.000000 0.000000 . . . |
0.250000 0.312500 0.347656 0.370864 0.387540 0.400187 0.410149 0.418222 0.424909 0.430547 0.435370 . . . |
0.500000 0.750000 1.062500 1.628906 3.153334 10.44351 109.5670 . . . |
I think you can spot the general trend. If your starting number is less than -2 or greater than 0.25, the sequence shoots off to infinity. Any other number draws the sequence towards a number, or makes it bounce around, but it never heads for the hills. Here’s a quick visual summary; the black areas on the line represent values which do not escape:
There’s some odd behaviour in those number sequences. To better see what’s going on, I’ll make a simple modification and expand the number of dimensions by one. Instead of adding single numbers, we’ll add pairs of them. Instead of using a line to demonstrate this, I’ll need an entire graph.
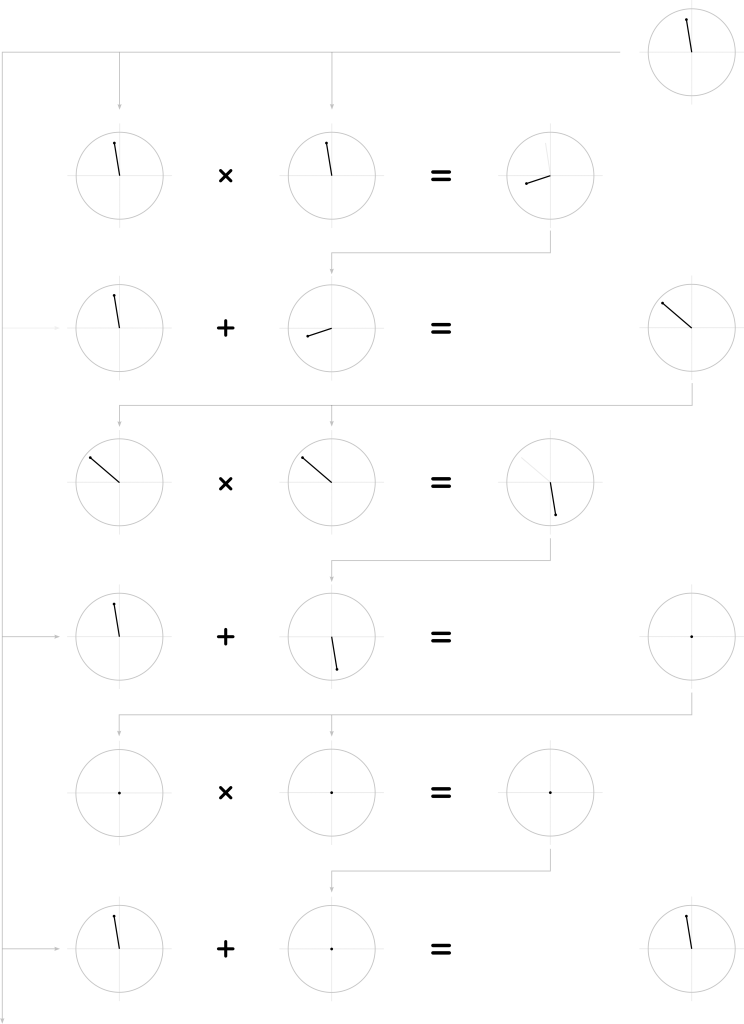
The steps will have to change, of course. Instead of doing the math on pen-and-paper, we’ll start off doing it visually. To add a pair of two-dimensional numbers, we plot them on the graph then draw a line from that number to a spot known as the origin, or (0, 0) in numbers. We then detach one of the lines from the origin, and move it along to the end of the other. Draw a line back from the new tip of the combined lines, and that’s your result.
Multiplication is a little tougher, but not by much. We need to add a “reference line” of sorts, by drawing a line that starts at the origin, and extends to the right as far as is convenient for us. Convert both numbers you want to multiply into line form, like we did for addition, but this time measure the angle between them and this “reference line” by going clockwise from the number’s line. We’ll also need to know the length of each number’s line. Given all that, form a new line that’s the sum of the angles of the original two numbers, and of a length that’s equal to the two number’s lengths multiplied together.
Since we’re only multiplying a number by itself here, we can simplify a bit. In this case, we merely double the angle it has from the reference line, and square its length.
Armed with our new methods, we can now do the two-dimensional version of our earlier math.
You can easily verify the visual version. If all the points lie on the horizontal axis, the visual approach gives the same results as good ol’ one-dimentional addition and multiplication. Try it, and see for yourself.


