Inflation has been high recently, not just in the US but in many parts of the world. How inflation is calculated is to take a basket of goods and calculate their cost and see how they change over time. In the US, there are two inflation indices: regular inflation and what is called ‘core inflation’, which omits food and fuel from the basket because those tend to fluctuate more over the short term and thus introduces volatility.
Whichever index you choose, whenever the inflation figures are reported each month in the US, Kevin Drum complains about the fact that it is the year-over-year number that is reported. He says that this gives a misleading picture of whether there is inflation right now and that a month-to-month comparison would be better.
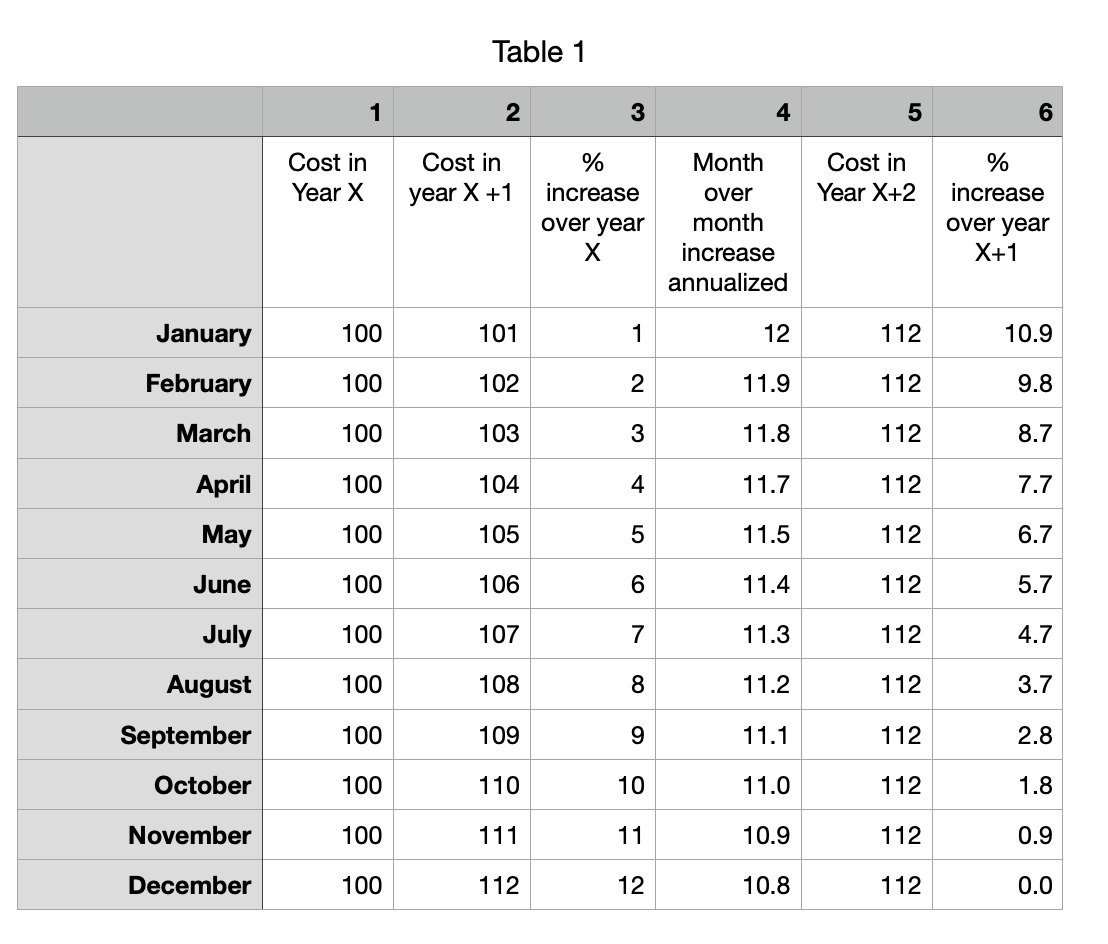
To sharply illustrate his point, I have made a chart of hypothetical costs for a basket of goods for three years: X, X+1, X+2.
In the year X (column 1), the prices remain flat at 100 for the entire year. i.e., the inflation rate is zero.
Starting in year X+1, the prices go up by one unit each month (column 2). We see in column 3 that the year-over-year inflation figures rose from 1% in January to 12% in December. But we can also calculate the month-over-month increases (annualized) and that is given in column 4.
Now assume that prices suddenly stopped increasing for the entire year X+2 (column 5). In other words, inflation has ceased altogether and the month-over-month inflation is zero. But the year-over-year figures will still be high, though decreasing gradually until it reaches zero in December (column 6). This is because the earlier rises have been baked in to the costs.
Drum argues that the month-over-month inflation number gives us a better idea of current inflation. In the real world, since year-over-year inflation has been steadily decreasing since around June of this year, he argues that this is because inflation has actually already stopped and that the numbers that are reported are the baked-in earlier increases. By reporting only the yearly figures, people think that inflation is still raging.
I think that there is some value in the year-over-year inflation figures so it should not be dispensed with. Perhaps the solution is to report both, so that we get a better idea of the state of inflation.


It seems that the choice of language could help here. For example, the month-over-month rate could be described as the “current inflation rate” (or similar), whereas the year-over-year could be stated as “price changes since a year ago”. That might help non-math-nerds get a better handle on the concepts.
Sample news report: “The latest report from the government shows that inflation is currently running at around 2% per year, with your shopping cart costing about 5% more than this time last year.”
Same in many places. AKA the “honest inflation rate” and “the inflation rate ignoring the things that really go up and that people still have to pay for, because they make us look bad despite us either not having much control over them (such as fuel prices) or we have control over them but we’ve made a decision that it’s politically advantageous to encourage them to outstrip other indices (such as house prices)”.
It looks like the Fed look mostly at the monthly year-on-year values (both all-prices and core, though they use a slightly different inflation measure than most folks.) My guess is that they feel that using month-on-month would lead to excessive volatility in any corrections they attempt, with a knock on effect on the economy. Smaller scale corrections held for a longer term is probably the name of their game. They look at many other metrics than just inflation in any case, and what they’re really trying to do is guess what the end of year annual inflation rate is likely to end up as under current conditions, so that they can come up with an interest rate level -- 8 times a year -- that attempts to move annual inflation closer to their 2% target.
(In other words, “what is instantaneous inflation *right now*” may be a less useful question than you might think, and potentially dangerous depending on what you’re using it for.)
I grew up with month over month inflation reported. I also grew up in times of hyperinflation, where the month over month inflation was in double digits and the annual in triple. Inflation figures were always reported on the 15th of the month and reported the price increase from the 1st of the previous month to the 1st of the current month. There were also separate reports of price indices for fresh produce (where seasonality is strongest) and construction (both materials and labor) and who knows what else,