Here’s a map of average precipitation across the US.
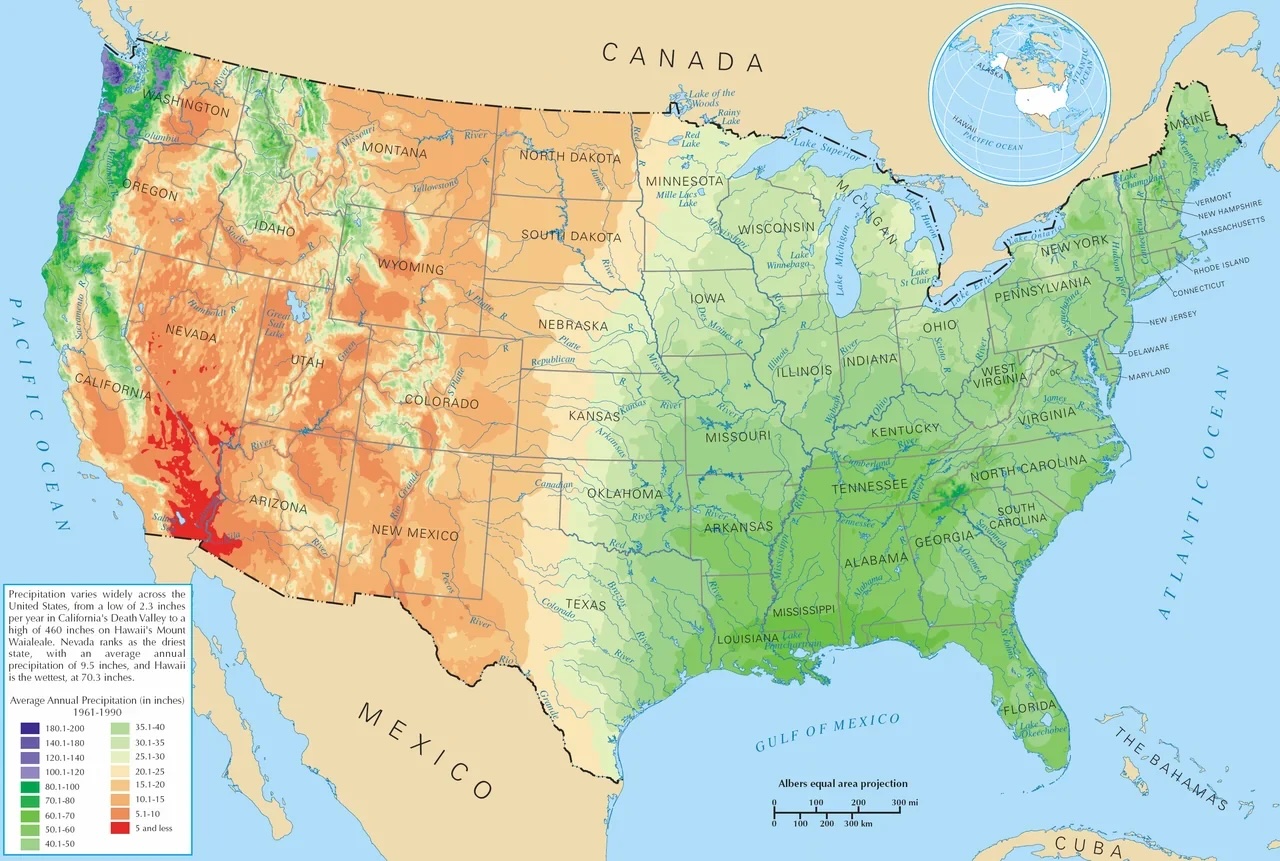
I’m in the dry band that stretches from Texas to Minnesota, drawing a vertical line across the middle of the country. I grew up in the dark green to purple wet part of the country on the West coast, and my favorite part of the world is that dark purple blotch over the Olympic peninsula.
No wonder I’m thirsty. I need to get a drink of water and get to work now.

1990, eh? Well, that’s going right out the window.
I’ve traveled the world, nothing is better than the Olympic mountains region.
Some of our organization spent a decade in oregon. They had a 2+ acre forest they lived in and cared for. They loved it, except for the ever-increasing danger of wild fire and the incessant wood smoke damaging their lungs.
We are now all in a ‘dry band’ in scarizona. Lots of minuses, a few pluses.
Stay safe people. (it’s getting more and more difficult to do that)
The map may in for some changes if climate change ever becomes a thing. /s
2024 hasn’t been kind to that map.
As a Pennsylvanian who enjoys “average” with decent precipitation and temperatures (and owns a house on high ground), I hope 2024 is just an anomaly, but I’m mentally preparing for an upward trend in subsequent years.
We are about to finish October without a single drop of rain, less than .8 inches in all of September, and June through August didn’t see much either.
I’m won’t be surprised if the New Jersey Pine Barrens explode in uncontrollable flames any day now.
Good video on this here – Why 80% of Americans Live East of This Line by RealLifeLore Twenty minutes length.