This article from Kiara Alfonseca of ProPublica got me thinking.
Fake hate crimes have a huge impact despite their rarity, said Ryan Lenz, senior investigative writer for the Southern Poverty Law Center Intelligence Project. “There aren’t many people claiming fake hate crimes, but when they do, they make massive headlines,” he said. It takes just one fake report, Lenz said, “to undermine the legitimacy of other hate crimes.”
My lizard brain could see the logic in this: learning one incident was a hoax opened up the possibility that others were hoaxes too, which was comforting if I thought that world was fundamentally moral. But with a half-second more thought, that view seemed ridiculous: if we go from a 0% hoax rate to 11% in our sample, we’ve still got good reason to think the hoax rate is low.
With a bit more thought, I realized I had enough knowledge of probability to determine who was right.
We start with the binomial distribution, 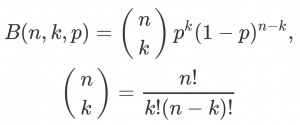 where n is the total number of samples, k is the number of successes or failures, and p is the odds of success/failure. We’ll say the latter represents the probability that any given hate crime is legit, and thus k represents the number of hate crimes observed.
That article focused specifically on the experience of a small liberal arts college in Minnesota.
The consequences from the events at St. Olaf are hard to quantify. But what’s clear is that the phony claim has overshadowed the other incidents — eight in all — all of which appear to have been bona fide hate messages. They remain the subject of an investigation, according to Northfield Police Chief Monte Nelson, with no hint that his officers are close to finding a culprit.
So let’s start off with a sample of eight hateful incidents, all of which were legit. That leaves a single free variable, the odds of a hate crime being legit. Gosh, that’s a simple probability distribution. Let’s plot it!
 It’s more convenient to deal with the cumulative distribution, though.
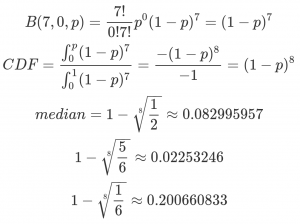
 Soooo simple. I can use a pocket calculator to figure out the median probability and some 16/84 error bars.
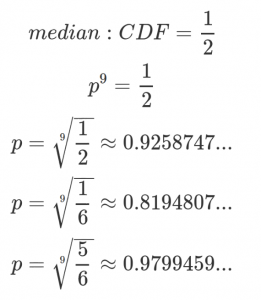
So the median probability of a legit hate crime is roughly 25/27. Now let’s add that one false report into the mix.
 A bit more complicated, but not by much.
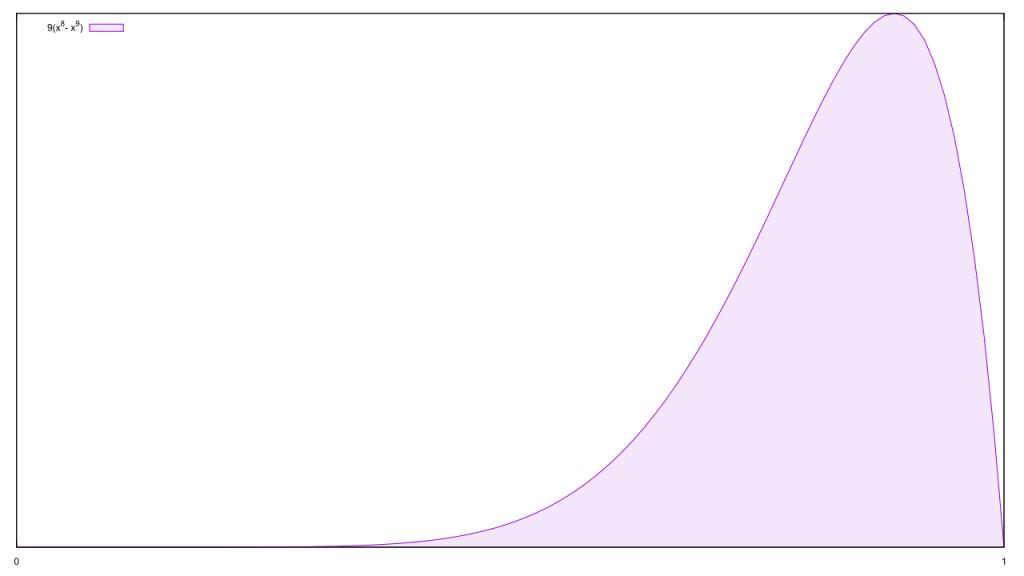 Figuring out our median and 16/84 error bars is a bit trickier, but we can always do it analytically via Halley’s method. To a programming sandbox!
Median value of the CDF is 0.837737271804753880211081, +0.088073481115690133158580 -0.127054647989486180215124
	(16% = 0.925810752920444013369661, 84% = 0.710682623815267699995957)
Hmm, there isn’t much of a fall between 92.6% and 83.8%. On a purely analytic level, then, a fake hate crime shouldn’t have carried much impact here.
Maybe things change when I explicitly invoke a probability framework? Frequentism doesn’t have a lot to say here; because it treats the data as random variables and the parameters as fixed, there’s no actual hypothesis being tested. Instead, we must either bring one to the table or pull it off the data. The most common way to do the latter is Maximum Likelihood estimation. Look back at the first graph: the maximum likelihood of the eight-legit case is 100%, while the eight-legit-one-false’s is
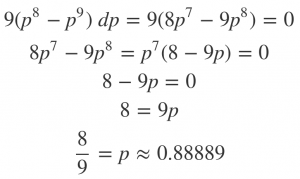 In one sense, this is a huge leap; going from a 100% legit rate to anything less destroys the illusion of perfection. Still, an 89% chance of legitimacy is quite different from a “huge impact” that “undermine[s] the legitimacy of other hate crimes,” so that can’t be the explanation.
Bayesian statistics also doesn’t have a lot to say, by the way, but for a different reason: we haven’t added a prior into the mix. If we take the Objective Bayesian approach and invoke a flat prior, however, our likelihood distribution is equivalent to our posterior. As the data is fixed and parameters vary, in Bayes world we’re pitting an infinite number of hypotheses against each other, at least one for every possible value of p. In theory we could also invoke Maximum Likelihood, but in practice most Bayesians prefer to add credible intervals and other hints at the shape of the posterior. The above “error bars” map neatly to credible intervals, and unlike frequentism not even the hint of a paradox arises.
Something else must be going on here, and I think I know what. Let’s say each legit report is worth, say, three fifths of a fake one. Eight of them is demoted to the equivalent of five, and this changes the math appropriately.
Median value of the CDF in the 5+0 case is 0.890898718140339274107475, +0.079171397305461077564814 -0.149062342549936999169802
	(16% = 0.741836375590402274937674, 84% = 0.970070115445800351672290)

Median value of the CDF in the 5+1 case is 0.771510036493403883461895, +0.121743252268576407360001 -0.165465494455401262996475
	(16% = 0.606044542038002620465420, 84% = 0.893253288761980290821896)
That’s a bigger drop, though still not a dramatic one. We’re getting closer, though…
t+f	med      	84th      	16th      	t+f	med      	84th      	16th
10+0	0.93893091	0.98356192	0.84968701	10+1	0.86402054	0.93833865	0.75436842
9+0	0.93303299	0.98193304	0.83595880	9+1	0.85203657	0.93265296	0.73429757
8+0	0.92587471	0.97994586	0.81948074	8+1	0.83773727	0.92581075	0.71068262
7+0	0.91700404	0.97746754	0.79933917	7+1	0.82038039	0.91741860	0.68250590
6+0	0.90572366	0.97429033	0.77416857	6+1	0.79886881	0.90688133	0.64832679
5+0	0.89089872	0.97007012	0.74183638	5+1	0.77151004	0.89325329	0.60604454
4+0	0.87055056	0.96419250	0.69882712	4+1	0.73555002	0.87493464	0.55249312
3+0	0.84089642	0.95544279	0.63894310	3+1	0.68618983	0.84898300	0.48273771
2+0	0.79370053	0.94103603	0.55032121	2+1	0.61427243	0.80931276	0.38891466
1+0	0.70710678	0.91287093	0.40824829	1+1	0.50000000	0.74085099	0.25914901
Ah, there we go. If we discount all but one legit hate crime, we can finally get a swing that makes skepticism about hate crimes justified. Look at articles about fake hate crimes from groups invested in promoting them, though, and we see something different…
“When we have some kind of finalized investigation, absolutely — so, you know, there’s a great rule, all initial reports are false, you have to check them and you have to find out who the perpetrators are,” Gorka said in response to a question about whether the White House will address the bombing.
“We’ve had a series of crimes committed, alleged hate crimes, by right wing individuals in the last six months that turned out to actually have been propagated by the left,” he said.
The purpose of this site is to compile a comprehensive database of the false reports of “hate crimes” committed in the USA.
Explicitly stating that legit hate crimes don’t “count” as much as fake ones would be an open declaration of bigotry. Instead, we can implicitly accomplish the same by saying fake hate crimes are common, thus skepticism is justified. This looks Bayesian at first blush, but in truth it overemphasizes the prior and ignores new evidence. Suppose that, before we learned of these hate crimes, we knew of seven false ones and no legit ones.
We’ve got strong reason to be skeptical of hate crimes. After we learn of the new ones, however, we have eight legit ones and eight false ones.
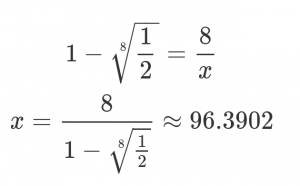
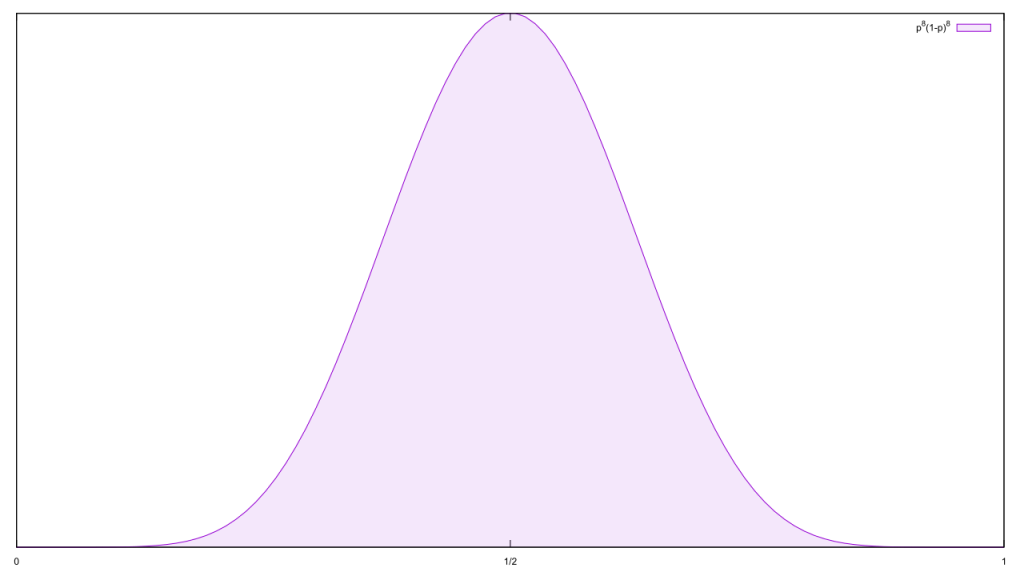 Now we should be equivocal about the validity of hate crimes; Gorka’s default of skepticism is no longer justified. To at least maintain our original level of skepticism, we’d need ninety-seven new fakes.
 In a proper Bayesian framework, the prior is almost always swamped by additional evidence. The exceptions are either because the hypothesis is so heavily justified with prior evidence or logical argument that in practical terms it cannot be refuted, such as with gravity or evolution, or because there is almost no evidence. Neither apply here; said database of fake hate crimes contains 241 entries, and we know that fake hate crimes exist so we cannot completely rule them out.
It’s notable what counts as a “fake,” though. That database of fake hate crimes includes this entry:
We don’t know whether it is a hoax or not, but the author of the Guardian article about it does.
The author claims that he “knows” the president is ignoring a suspected hate crime at a Minnesota mosque because “the administration is more than willing to sacrifice different segments of the American [public to keep itself in power.”]
Which, first off, is not evidence of a fake hate crime. Nor is the thesis of the article even about hate crimes. Here’s the full context for the part they quote:
What’s long been clear from this White House is that Donald Trump has absolutely no interest in being the president of all Americans. His statements and actions are always calculated to appeal narrowly to his core constituency in order to further the divisions and hatreds in our society, thereby reinforcing his base. […]
Gorka’s comments [about fake hate crimes] and Trump’s actions show that this administration is more than willing to sacrifice different segments of the American public to keep itself in power. They seek no other way.
This would be just as true if the Minnesota mosque bombing turned out to be a fake hate crime. Flip through that database, and you’ll see plenty more examples where even non-evidence renders a hate crime to be fake; this would not be possible if legit hate crimes were considered with equal seriousness. Reality is far more prosaic, as per that Guardian article:
Never mind that the number of false reports of hate crimes in the wave of violence following the election of Donald Trump was just over a measly 1% (13 out of 1,094).
So if we use the SPLC’s numbers as our prior, the posterior of our baseline belief that any given hate crime is legit is
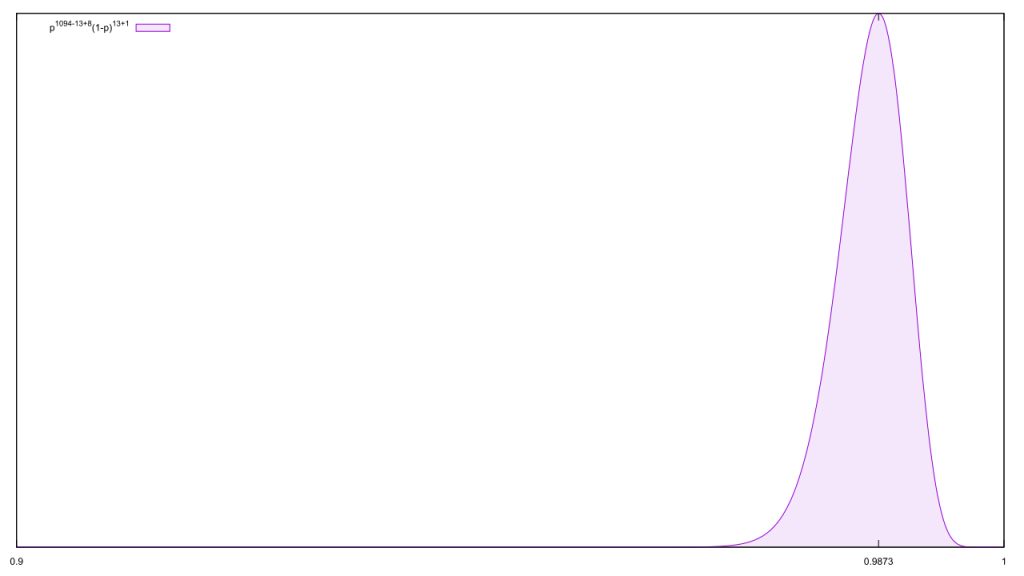 Time and again, we find evidence that people dismiss legitimate hate crimes in some form or another. This is completely at odds with how we should treat them, and a sure sign that many if not most people are, at best, closeted bigots.

